
In May, the US Personal Consumption Expenditures Price Index reached 0.4% month-on-month, 0.1 percentage points below forecasts, while accelerating from 3.8% to 4.1% year-on-year, reaching its highest level since April 2023 and exceeding the 4.0% threshold for the first time since then. The core indicator, which excludes food and energy prices, increased from 3.3% to 3.4%, its highest level since October 2023. On the other hand, first-quarter Gross Domestic Product (GDP) was revised from 1.6% to 2.1%, supporting the US dollar. Initial jobless claims for the week ending June 19 fell from 227.0 thousand to 215.0 thousand, compared with expectations of 225.0 thousand, while continuing claims increased from 1.800 million to 1.821 million, in line with neutral market expectations.
Analysts at the Confederation of British Industry (CBI) reported that in June, the monthly retail sales balance declined from –46.0 points to –54.0 points, while the three-month average fell from –55.0 points to –56.0 points, the lowest level since records began in 1983. In addition, S&P Global data, which do not cover retail trade but are widely regarded as a leading indicator of economic growth, were also negative: the composite index fell from 49.7 points to 49.4 points, its lowest reading in 14 months, remaining in contraction territory for a second consecutive reporting period. The services index, which is particularly important for the UK economy, declined from 49.3 points to 48.7 points, its lowest level in 41 months, while the manufacturing index fell from 53.9 points to a three-month low of 53.1 points. At the same time, the industrial orders index declined from –41.0 points to –45.0 points, a six-month negative record, while the retail sales volume indicator showed the largest seasonal disappointment in the past two years, slowing from –46.0 points to –54.0 points. According to CBI Chief Economist Martin Sartorius, the negative dynamics are developing amid deteriorating consumer sentiment. He added that businesses need political stability, which remains a source of uncertainty and continues to put additional pressure on the pound. On June 22, Prime Minister Keir Starmer announced his resignation, while Chancellor of the Exchequer Rachel Reeves confirmed that former Manchester mayor Andy Burnham would become the leader of the Labour Party and head of government. These comments significantly supported the national currency; however, experts warn that the politician’s preferred expansionary fiscal policy, possible tax increases, and higher government bond issuance could weigh on the pound in the medium term.
Support and resistance levels
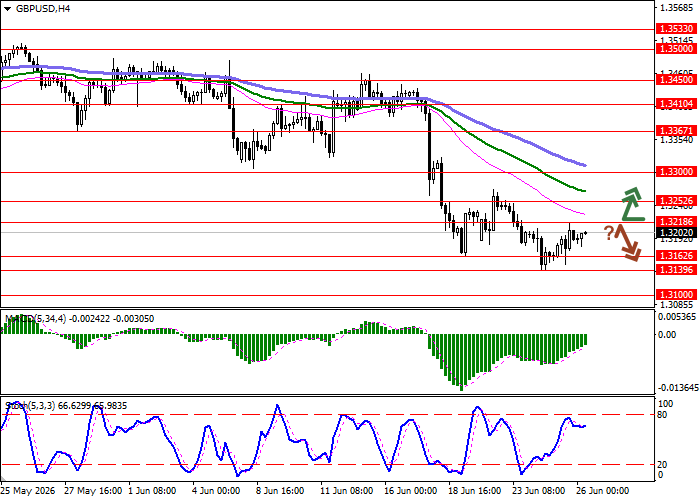
On the daily chart, the Bollinger Bands are declining: the price range is expanding to the downside while remaining sufficiently wide for the current level of market activity. The MACD indicator is turning upward, preparing to move above the signal line and form a buy signal. The Stochastic is moving away from the “20” level, which indicated the likelihood of the asset being oversold in the ultra-short term.
Resistance levels: 1.3218, 1.3252, 1.3300, 1.3367.
Support levels: 1.3162, 1.3139, 1.3100, 1.3037.
Trading scenarios and GBP/USD forecast
Long positions may be opened after a breakout above 1.3218, with a target at 1.3300. Stop-loss: 1.3180. Expected implementation period: 1–2 days.
Short positions may be opened after a rebound from 1.3218 and a breakdown below 1.3162, with a target at 1.3100. Stop-loss: 1.3200.
Main scenario
| Timeframe | Intraday |
| Recommendation | BUY STOP |
| Entry point | 1.3220 |
| Take Profit | 1.3300 |
| Stop Loss | 1.3180 |
| Key levels | 1.3037, 1.3100, 1.3139, 1.3162, 1.3218, 1.3252, 1.3300, 1.3367 |
Alternative scenario
| Recommendation | SELL STOP |
| Entry point | 1.3160 |
| Take Profit | 1.3100 |
| Stop Loss | 1.3200 |
| Key levels | 1.3037, 1.3100, 1.3139, 1.3162, 1.3218, 1.3252, 1.3300, 1.3367 |
