

The key bullish signal for the dollar came from the results of the two-day U.S. Federal Reserve monetary policy meeting under the leadership of the agency’s new Chair Kevin Warsh: officials unanimously kept the interest rate in the 3.50–3.75% range, but the “dot plot” and the regulator’s rhetoric changed dramatically. While in March none of the nineteen members of the Federal Open Market Committee (FOMC) expected an increase in borrowing costs this year, now nine of them expect at least one 25-basis-point increase, five expect 50 basis points, and one expects 75 basis points. The wording about a “soft policy bias” was completely removed from the accompanying statement, while the document itself was shortened to 130 words from the usual 300–340 words. At present, according to the Chicago Mercantile Exchange (CME) FedWatch Tool, the probability of tighter credit conditions in September stands at 70.0%, as a result of which the U.S. dollar gained 1.02% over the week. Analysts at The Goldman Sachs Group Inc. revised their assumptions for the gold price, reducing them by around 500.0 dollars per troy ounce by the end of the year, as the Fed’s hawkish stance is changing the situation in the precious metals market. Quotes are now expected to reach 4900.00: positive dynamics will persist in the second half of the year, but more as a fading wave rather than a strong upward trend.
It should be noted that the sector has become destabilized in recent months: due to heightened geopolitical tensions in the Middle East, energy prices have risen significantly, increasing the probability of a Fed rate hike, while price growth spread across the entire commodities and safe-haven segment, putting pressure on metal quotes. Experts note that the forecast reduction is also linked to weaker expected inflows into gold-backed ETF funds, meaning institutional demand may not be as active as previously anticipated. At the same time, the bank’s economists shifted expectations for the regulator’s return to a dovish stance to June–December next year, whereas earlier projections referred to December 2026 and March 2027. If borrowing costs rise, demand for gold as a hedging instrument against macroeconomic risks could weaken significantly, and in a stress scenario its price may reach 4400.00.
The geopolitical factor, which supported the XAU/USD pair for several months, has recently had a negative impact on it instead: on June 18, the United States and Iran signed a memorandum on the cessation of hostilities, under which commercial vessels are granted free passage through the Strait of Hormuz for 60 days. More than 12.0 million barrels of oil were transported through it overnight, which significantly reduced the geopolitical risk premium. Nevertheless, doubts about a diplomatic settlement of the conflict reappeared over the weekend: according to the Iranian Tasnim news agency, representatives of Tehran left the venue of the negotiations in Bürgenstock, Switzerland, in protest against aggressive statements by U.S. President Donald Trump in an interview with Fox News and on the Truth Social platform.
Support and resistance levels
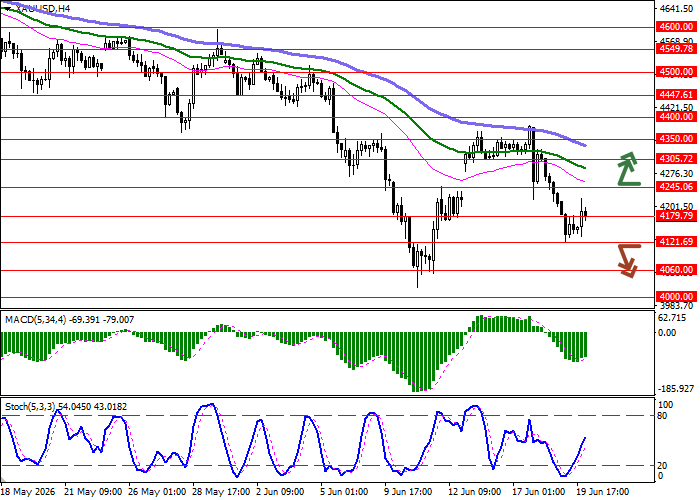
On the daily chart, Bollinger Bands are declining moderately: the price range is narrowing, reflecting mixed trading in the ultra-short term; the MACD indicator maintains a weak sell signal, with the histogram positioned below the signal line, while the Stochastic is rapidly approaching the “20” mark, indicating limited risks of the instrument becoming oversold in the nearest time intervals.
Resistance levels: 4245.06, 4305.72, 4350.00, 4400.00.
Support levels: 4179.79, 4121.69, 4060.00, 4000.00.
XAU/USD trading scenarios and forecast
Long positions may be opened after a breakout above 4245.06, with a target at 4400.00. Stop-loss — 4179.79. Expected timeframe: 2–3 days. Short positions may be opened after a breakout below 4121.69, with a target at 4000.00. Stop-loss — 4179.79.
Scenario
| Timeframe | Intraday |
| Recommendation | BUY STOP |
| Entry point | 4245.10 |
| Take Profit | 4400.00 |
| Stop Loss | 4179.79 |
| Key levels | 4000.00, 4060.00, 4121.69, 4179.79, 4245.06, 4305.72, 4350.00, 4400.00 |
Alternative scenario
| Recommendation | SELL STOP |
| Entry point | 4121.65 |
| Take Profit | 4000.00 |
| Stop Loss | 4179.79 |
| Key levels | 4000.00, 4060.00, 4121.69, 4179.79, 4245.06, 4305.72, 4350.00, 4400.00 |
