
In February, exports increased by 4.2%, significantly exceeding forecasts of 1.6%, while imports rose by 10.2% compared to expectations of 11.5%. As a result, the trade balance posted a surplus of 57.3 billion yen, confirming signs of recovery in the Japanese economy. However, analysts warn that rising oil prices amid the US–Iran conflict could slow industrial activity, putting pressure on production capacity and GDP growth. Meanwhile, Finance Minister Satsuki Katayama has repeatedly hinted at potential currency interventions, stating that authorities are closely monitoring market conditions and stand ready to act against excessive volatility. Against this backdrop, the pair pulled back toward 158.59 (Murray [6/8]). Traders are now focused on key events: the Federal Reserve meeting today at 20:00 (GMT+2) and the Bank of Japan decision tomorrow at 05:00 (GMT+2), both of which could trigger significant volatility. Most likely, both central banks will keep rates unchanged amid geopolitical uncertainty, with markets closely watching forward guidance. Earlier, BoJ Governor Kazuo Ueda stated that core inflation is gradually accelerating toward the 2.0% target, emphasizing that price growth must be supported by wage increases. Despite these hawkish signals, tightening policy remains unlikely given pressure on Japan’s export-driven economy.
At the same time, Federal Reserve officials continue to prioritize inflation risks. In February, headline CPI stood at 2.4% year-on-year, while core inflation reached 2.5%, even before the full impact of rising energy prices due to disruptions in the Strait of Hormuz. As a result, maintaining elevated interest rates for a prolonged period remains a likely scenario, which would support the US dollar.
Support and resistance levels
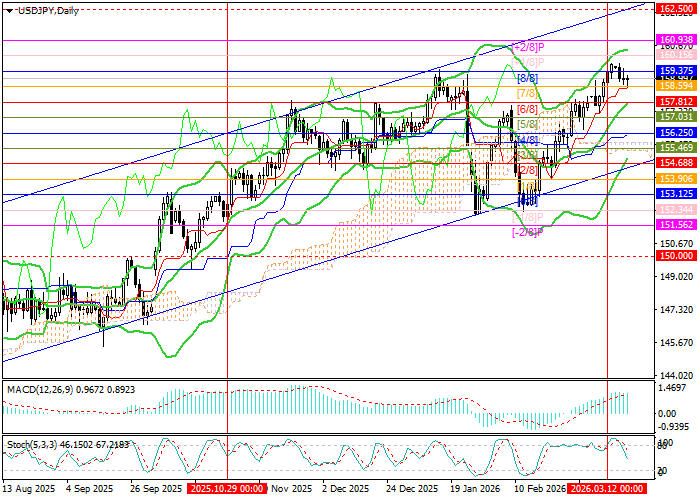
The instrument is trading near 159.37 (Murray [8/8]). A breakout above this level would open the way toward 160.93 (Murray [+2/8]) and 162.50 (Murray [8/8], W1). However, if the price consolidates below the middle Bollinger Band at 157.81 (Murray [6/8]), a decline toward 156.25 (Murray [4/8]) and 154.68 (Murray [2/8], the lower boundary of the long-term ascending channel) may follow.
Technical indicators maintain a buy signal: Bollinger Bands are turning upward, the MACD histogram is expanding in positive territory, while the Stochastic oscillator is reversing downward from overbought levels, indicating the risk of a limited correction.
Resistance levels: 159.37, 160.93, 162.50.
Support levels: 157.81, 156.25, 154.68.
Trading scenarios and USD/JPY forecast
Long positions can be opened above 159.37 with targets at 160.93 and 162.50 and a stop-loss at 158.10. Timeframe: 5–7 days.
Short positions can be opened below 157.81 with targets at 156.25 and 154.68 and a stop-loss at 158.90.
Scenario
| Timeframe | Weekly |
| Recommendation | BUY STOP |
| Entry point | 159.40 |
| Take Profit | 160.93, 162.50 |
| Stop Loss | 158.10 |
| Key levels | 154.68, 156.25, 157.81, 159.37, 160.93, 162.50 |
Alternative scenario
| Recommendation | SELL STOP |
| Entry point | 157.80 |
| Take Profit | 156.25, 154.68 |
| Stop Loss | 158.90 |
| Key levels | 154.68, 156.25, 157.81, 159.37, 160.93, 162.50 |
