
The parties to the conflict managed to agree on a two-week ceasefire, followed by separate talks in Pakistan to clarify the remaining details of the deal. This significantly eased geopolitical tensions in the Middle East and reduced the likelihood of a global economic slowdown. Experts note that the negative movement appears to be more of a sharp correction than a fully formed trend, while the negotiations do not guarantee a final end to hostilities. In addition, under the current terms of the agreement, the Strait of Hormuz will remain under the control of the Islamic Revolutionary Guard Corps (IRGC), which will impose duties on vessels passing through it. This could generate annual revenue of $64.0 billion and raise transportation costs. As a result, energy prices are likely to remain elevated, putting pressure on economies that actively import hydrocarbons, including Japan’s.
Meanwhile, in February, the Coincident Indicators Index fell by 1.6 points to 116.3, largely due to reduced shipments of semiconductor chips and semiconductor manufacturing equipment, as well as lower automobile production. This calls into question the Bank of Japan’s claim that stable global demand will support the country’s export volumes. In March, the manufacturing PMI declined from 53.0 to 51.4, while the services PMI slipped from 53.8 to 53.4. At the same time, the consumer price index reached 1.3%, and the core reading stood at 1.6%, both below the regulator’s target. As a result, officials may refrain from tightening monetary policy in the near future, which would increase pressure on the yen and could lead to an upward reversal in USD/JPY.
The US dollar may return to positive dynamics due to the Federal Reserve’s likely prolonged maintenance of its current monetary policy stance. Despite the reduced risk of accelerating inflation linked to the Middle East operation, high US trade tariffs continue to weigh on the economy. Given the strong labor market, where unemployment fell to 4.3% in March and nonfarm payrolls rose by 178.0K against expectations of 65.0K, policymakers prefer to remain cautious and, according to most experts, are likely to adjust interest rates by -25 basis points at the end of the year.
Overall, long-term fundamental factors support the resumption of growth in the USD/JPY pair.
Support and resistance levels
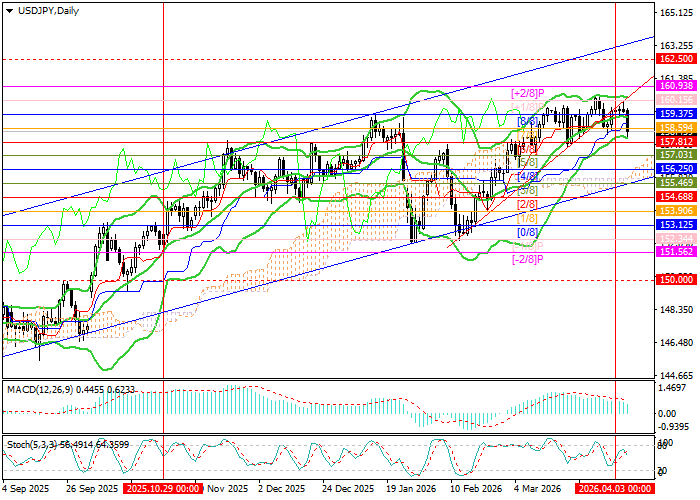
The trading instrument is located close to the lower boundary of the Bollinger Bands at 157.81 (Murray level [6/8]), a breakout below which would likely trigger a deeper downward correction toward 156.25 (Murray level [4/8]) and 155.46 (Murray level [3/8], the lower boundary of the long-term ascending channel). However, if the price breaks above 160.15 (Murray level [+1/8]), a rise toward 162.50 (Murray level [8/8], W1) is likely.
Technical indicators do not provide a unified signal: Bollinger Bands are horizontal, the MACD histogram is decreasing in positive territory, and Stochastic is turning downward from the overbought zone.
Resistance levels: 160.15, 162.50.
Support levels: 157.81, 156.25, 155.46.
Trading scenarios and USD/JPY forecast
Long positions may be opened above 160.15 or upon a price reversal near 156.25, with a target at 162.50 and stop-losses around 158.90 and 154.90, respectively. Expected implementation period: 5-7 days.
Scenario
| Timeframe | Weekly |
| Recommendation | BUY STOP |
| Entry Point | 160.20 |
| Take Profit | 162.50 |
| Stop Loss | 158.90 |
| Key Levels | 155.46, 156.25, 157.81, 160.15, 162.50 |
Alternative Scenario
| Recommendation | BUY LIMIT |
| Entry Point | 156.25 |
| Take Profit | 162.50 |
| Stop Loss | 154.90 |
| Key Levels | 155.46, 156.25, 157.81, 160.15, 162.50 |
