

January inflation data has already exceeded the regulator’s forecasts: the headline consumer price index reached 3.0% year-on-year, eleven basis points above preliminary estimates, while the core indicator and services CPI stood at 3.1% and 4.4%, exceeding expectations by eighteen and twenty-four basis points, respectively.
Investors are also focusing on updated projections from major financial institutions. Analysts at Bank of America Corp. expect the UK economy to grow by 1.2% in 2026 and 1.4% in 2027, with inflation at 2.2% and 2.0%, respectively, while highlighting rising stagflation risks amid the rapid increase in energy prices. Meanwhile, JPMorgan Chase & Co. has revised its outlook, projecting an average inflation rate of 2.9% in the second half of 2026, compared to a previous estimate of 2.2%.
The direct contribution of energy prices to consumer inflation could reach up to 0.6 percentage points by the third quarter, while rising gasoline and diesel prices may add another 0.2–0.3 percentage points. Additional pressure comes from the worsening geopolitical situation in the Middle East, which has already driven oil prices up by 25.0% and natural gas prices by 26.0% compared to the levels assumed in the Bank of England’s February monetary policy report. This factor alone is expected to add approximately 0.3 percentage points to inflation.
Against this backdrop, analysts at Barclays believe the regulator is highly likely to keep the base interest rate at 3.75%, abandoning earlier expectations of a 25-basis-point cut.
A fairly expected reaction to capital outflows from equities amid the Middle East crisis is a local increase in bond yields. Short-term one-year government bonds are now trading at 4.047%, up from 3.976% last Friday. Ten-year yields have risen to 4.745% from 4.697%, while 20-year and 30-year yields stand at 5.349% and 5.406%, compared to 5.308% and 5.373%, respectively.
Top gainers within the index include Diploma Plc (+17.79%), Babcock International Group Plc (+2.05%), Weir Group Plc (+2.03%), and Standard Chartered Plc (+1.68%).
Among the biggest decliners are 3i Group Plc (–4.80%), Compass Group Plc (–4.54%), Metlen Energy & Metals Plc (–4.29%), and Fresnillo Plc (–3.65%).
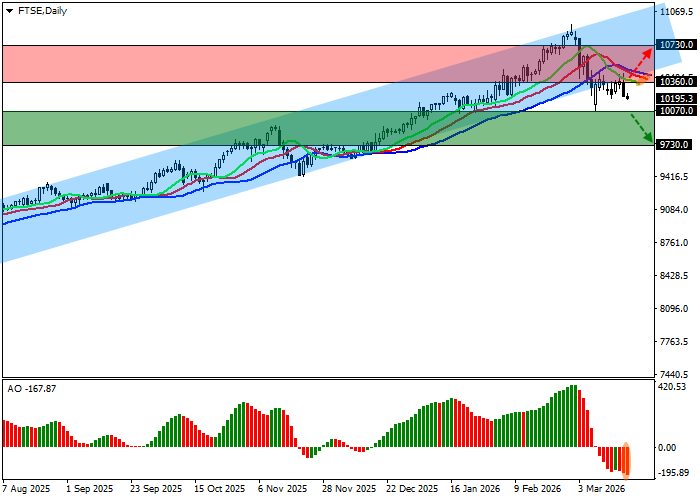
Support and resistance levels
On the daily chart, the instrument is once again attempting to approach the support line of the ascending channel at 11000.0–10100.0.
Technical indicators maintain a stable sell signal, which is strengthening amid the local correction: the EMA range within the Alligator indicator is gradually expanding, while the AO histogram is forming new corrective bars below the zero line.
Support levels: 10070.0, 9730.0.
Resistance levels: 10360.0, 10730.0.
Trading scenarios and FTSE 100 forecast
Short positions may be considered after the price consolidates below 10070.0, targeting 9730.0. Stop-loss — 10250.0. Timeframe: 7 days or more.
Long positions may be considered after consolidation above 10360.0, targeting 10730.0. Stop-loss — 10150.0.
Scenario
| Timeframe | Weekly |
| Recommendation | SELL STOP |
| Entry point | 10069.5 |
| Take Profit | 9730.0 |
| Stop Loss | 10250.0 |
| Key levels | 9730.0, 10070.0, 10360.0, 10730.0 |
Alternative scenario
| Recommendation | BUY STOP |
| Entry point | 10360.5 |
| Take Profit | 10730.0 |
| Stop Loss | 10150.0 |
| Key levels | 9730.0, 10070.0, 10360.0, 10730.0 |
