

September inflation data released yesterday showed renewed price pressures in the British economy. According to the UK Office for National Statistics, the consumer price index (CPI) slowed from 0.5% to 0.4% month-on-month, exceeding forecasts of 0.3%, while annual inflation accelerated from 3.1% to 3.5%, compared with expectations of 3.4%. Core inflation, excluding energy, food, alcohol and tobacco, rose by 0.2% on a monthly basis after remaining unchanged in August, while the annual rate increased from 2.6% to 2.8%. The main driver was a 29.8% annual increase in motor fuel prices, with petrol reaching its highest level since August 2022. The labour market has also remained relatively resilient: unemployment declined to 4.7% in the three months to August, while employment increased by 102.0K compared with the previous three-month period. These developments strengthen the case for further monetary tightening, with some analysts considering the possibility of rate increases in both November and December rather than just one move before the end of the year.
However, the upward movement could prove difficult to sustain if geopolitical tensions in the Persian Gulf escalate further. According to The New York Times, US and Israeli military officials have developed plans for another short but intensive phase of strikes against Iran. Although the preparations are primarily focused on the period after the US congressional elections, an earlier operation has not been completely ruled out. Meanwhile, the US State Department has ordered non-essential government employees and their family members to leave Saudi Arabia following attacks on civilian and critical infrastructure.
A renewed large-scale conflict could significantly increase inflation risks for the US economy, potentially prompting the Federal Reserve to accelerate monetary tightening. Such a development would support the US dollar and could put renewed downward pressure on GBP/USD.
Support and resistance levels
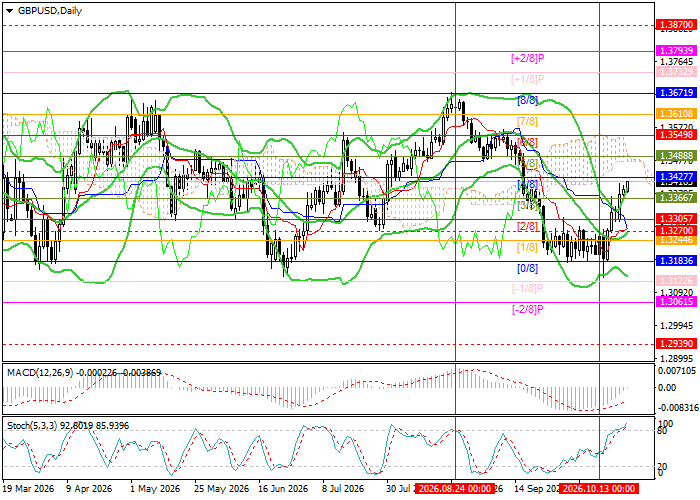
The trading instrument remains within a broad sideways range of 1.3183–1.3671 (Murray levels [0/8]–[8/8]), formed at the end of last year. The price is currently approaching 1.3427 (Murray level [4/8], middle Bollinger Band, W1). A sustained break above this level could lead to a recovery toward the upper boundary of the range at 1.3671 (Murray level [8/8]), followed by 1.3793 (Murray level [+2/8]) and 1.3870 (the area of yearly highs). However, a break below the middle Bollinger Band at 1.3270 could trigger a renewed decline toward 1.3183 (Murray level [0/8]), 1.3061 (Murray level [-2/8]) and 1.2939 (Murray level [2/8], W1).
Technical indicators are providing mixed signals: the Bollinger Bands are turning upward, while the Stochastic oscillator has entered overbought territory and may reverse lower. Meanwhile, the MACD histogram is preparing to move into positive territory.
Resistance levels: 1.3427, 1.3671, 1.3793, 1.3870.
Support levels: 1.3270, 1.3183, 1.3061, 1.2939.
GBP/USD Trading Scenarios and Exchange Rate Forecast
Long positions may be opened from 1.3450, with targets at 1.3671, 1.3793 and 1.3870, and a stop-loss at 1.3360. Estimated implementation period: 5–7 days.
Short positions may be opened below 1.3270, with targets at 1.3183, 1.3061 and 1.2939, and a stop-loss at 1.3330.
Scenario
| Timeframe | Weekly |
| Recommendation | BUY STOP |
| Entry Point | 1.3450 |
| Take Profit | 1.3671, 1.3793, 1.3870 |
| Stop Loss | 1.3360 |
| Key Levels | 1.2939, 1.3061, 1.3183, 1.3270, 1.3427, 1.3671, 1.3793, 1.3870 |
Alternative Scenario
| Recommendation | SELL STOP |
| Entry Point | 1.3270 |
| Take Profit | 1.3183, 1.3061, 1.2939 |
| Stop Loss | 1.3330 |
| Key Levels | 1.2939, 1.3061, 1.3183, 1.3270, 1.3427, 1.3671, 1.3793, 1.3870 |
