

The price movement comes amid persistent geopolitical tensions in the Persian Gulf, with fresh reports of attacks by Yemen's Houthis against Saudi Arabian targets. At the same time, oil transportation costs are rising across major shipping routes. Freight rates for crude shipments from Russia's Novorossiysk and Primorsk ports remain elevated, while transportation costs in the Middle East have reached exceptional levels. According to the Baltic Exchange, the time charter equivalent (TCE) rate for very large crude carriers (VLCCs) on the Persian Gulf-to-China route has approached $1.4 million per day, compared with much lower rates a year earlier. The surge reflects growing security risks and limited tanker availability, adding to the cost of delivering crude oil to international markets. Similar supply concerns were discussed in our previous WTI oil forecast.
Meanwhile, US crude inventories continue to decline. According to the American Petroleum Institute (API), stockpiles fell by 4.930 million barrels in the latest reporting week, following an 11.120 million-barrel reduction a week earlier. The US Energy Information Administration's (EIA) weekly report also showed a decline of 3.060 million barrels, compared with an 8.557 million-barrel draw in the previous period. Investment activity remains relatively strong amid uncertainty in the global energy market. According to CME Group figures cited in the market snapshot, approximately 1.02 million WTI futures contracts and 235.0K options contracts were recorded on October 20, compared with an average of around 220.0K options contracts the previous week.
Support and resistance levels
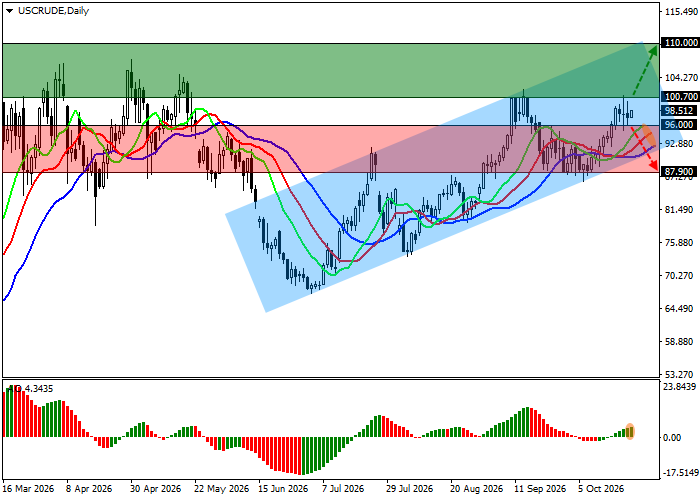
On the daily chart, the trading instrument remains above the support line of a local ascending channel with dynamic boundaries at 110.00–92.00.
Technical indicators continue to show uncertainty after generating a buy signal last week: the fast exponential moving averages (EMAs) of the Alligator indicator remain slightly above the slow ones, while the Awesome Oscillator (AO) histogram is forming corrective bars and approaching the zero line.
Support levels: 96.00, 87.90.
Resistance levels: 100.70, 110.00.
Trading scenarios
Long positions may be opened after the price rises and consolidates above 100.70, with a target at 110.00. Stop-loss: 98.00. Estimated implementation period: 7 days or more.
Short positions may be opened after the price declines and consolidates below 96.00, with a target at 87.90. Stop-loss: 99.00.
Scenario
| Timeframe | Weekly |
| Recommendation | BUY STOP |
| Entry Point | 100.70 |
| Take Profit | 110.00 |
| Stop Loss | 98.00 |
| Key Levels | 87.90, 96.00, 100.70, 110.00 |
Alternative Scenario
| Recommendation | SELL STOP |
| Entry Point | 96.00 |
| Take Profit | 87.90 |
| Stop Loss | 99.00 |
| Key Levels | 87.90, 96.00, 100.70, 110.00 |
