

The US dollar is once again benefiting from safe-haven demand as geopolitical tensions in the Persian Gulf intensify, pushing energy prices higher and reinforcing inflation expectations. These developments have increased speculation that the Federal Reserve could tighten monetary policy further in the coming months. However, most economists expect the central bank to leave interest rates unchanged at its October meeting and resume raising them in December. According to the CME FedWatch Tool, markets are pricing in a probability of around 88% for a December rate increase, while some analysts also consider the possibility of a larger 50-basis-point adjustment. Meanwhile, US housing data showed that building permits declined from 1.403 million in August to 1.400 million in September, although the result exceeded forecasts of 1.390 million.
The euro remains under pressure as political instability in France has pushed yields on 10-year government bonds close to their highest levels in nearly 24 years. Higher borrowing costs and political uncertainty are creating additional obstacles for the recovery of the eurozone's second-largest economy, which is already facing tighter financial conditions. Economic sentiment data have added to these concerns. According to ZEW's October Economic Sentiment report, the indicator for the eurozone declined from 25.8 to 18.5 points, falling short of expectations of 23.6 points. The corresponding German index dropped from 34.7 to 28.1 points against forecasts of 30.2. ZEW analysts note that private consumption and investment remain weak as elevated energy prices weigh on real incomes, increase production costs and keep inflationary pressure high for longer.
Overall, the fundamental backdrop continues to favour a medium-term decline in EUR/USD despite last week's upward correction.
Support and resistance levels
If the price breaks below 1.1169 (Murray level [-1/8]), the pair could extend its decline toward 1.0986 (Murray level [-2/8], W1) and 1.0850 (61.8% Fibonacci retracement). However, a sustained breakout above the middle Bollinger Band at 1.1352 (Murray level [2/8]) could trigger a renewed upward movement toward 1.1535 (Murray level [5/8], 23.6% Fibonacci retracement), 1.1718 (Murray level [8/8], upper boundary of the descending channel) and 1.1840 (Murray level [+2/8]).
Technical indicators continue to favour selling: the Bollinger Bands are turning downward, the MACD histogram remains stable in negative territory, while the Stochastic oscillator has reached the overbought zone and may reverse lower.
Resistance levels: 1.1352, 1.1535, 1.1718, 1.1840.
Support levels: 1.1169, 1.0986, 1.0850.
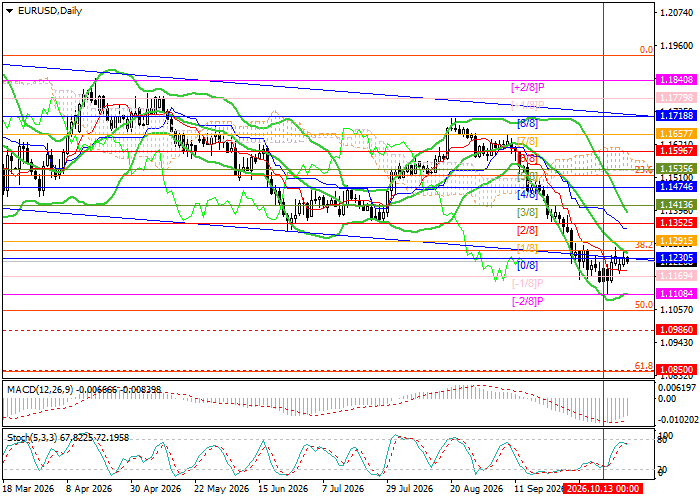
EUR/USD Trading Scenarios and Exchange Rate Forecast
Short positions may be opened below 1.1169, with targets at 1.0986 and 1.0850 and a stop-loss at 1.1270. Estimated implementation period: 5–7 days. Long positions may be opened above 1.1352, with targets at 1.1535, 1.1718 and 1.1840 and a stop-loss at 1.1230.
Scenario
| Timeframe | Weekly |
| Recommendation | SELL STOP |
| Entry Point | 1.1169 |
| Take Profit | 1.0986, 1.0850 |
| Stop Loss | 1.1270 |
| Key Levels | 1.0850, 1.0986, 1.1169, 1.1352, 1.1535, 1.1718, 1.1840 |
Alternative Scenario
| Recommendation | BUY STOP |
| Entry Point | 1.1352 |
| Take Profit | 1.1535, 1.1718, 1.1840 |
| Stop Loss | 1.1230 |
| Key Levels | 1.0850, 1.0986, 1.1169, 1.1352, 1.1535, 1.1718, 1.1840 |
