

At the end of September, the Reserve Bank of Australia (RBA) raised its benchmark interest rate from 4.35% to 4.60% to contain persistent consumer inflation. According to the RBA's official monetary policy statement, the decision reflects the central bank's commitment to returning inflation to its 2.0–3.0% target range while preserving employment gains as much as possible. Policymakers acknowledged that financial conditions remain restrictive, although the extent of that restriction is uncertain. Economic growth has slowed, but some areas of activity have proved more resilient than expected. Meanwhile, Australia's headline consumer price index rose by 0.4% month-on-month in August, while annual inflation accelerated from 3.5% to 4.0%. Persistent price pressures remain an important reason for keeping borrowing costs elevated.
The US dollar has maintained a generally upward trajectory since the beginning of the month. After recovering from a low near 98.00, the US Dollar Index (USDX) is holding around 101.50, supported by the relative resilience of the American economy amid the energy crisis and rising geopolitical tensions in the Persian Gulf. In the second quarter, US gross domestic product (GDP) growth was revised upward to an annualised rate of 2.2%, reinforcing the case for a restrictive monetary policy stance and increasing expectations of another Federal Reserve rate hike in December. The stronger dollar has continued to limit the Australian currency's recovery, as discussed in our previous AUD/USD forecast.
Overall, the Australian dollar's weakness and the possibility of further US dollar appreciation support a bearish outlook for AUD/USD in the medium term, despite the Reserve Bank of Australia's recent monetary tightening.
Technical indicators continue to favour selling. On the weekly chart, the trading instrument is attempting to break below a broad ascending channel with dynamic boundaries at 0.7300–0.7000.
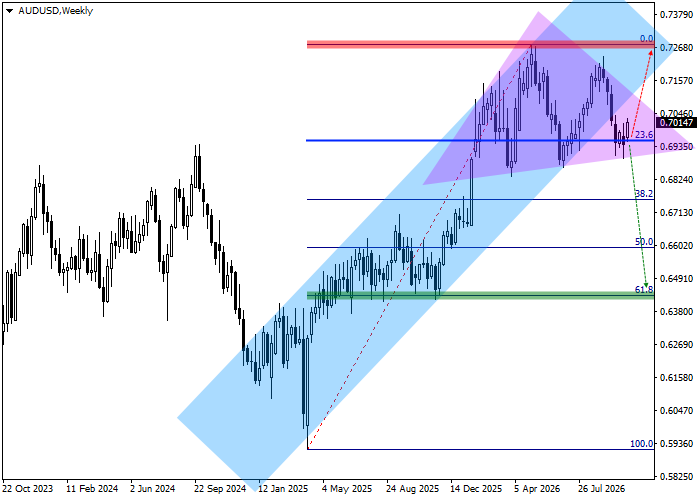
In early autumn, the price moved below the support line near 0.7040, providing an initial indication that the broader trend could be changing. The technical structure also suggests the formation of a large head-and-shoulders reversal pattern, with the second shoulder taking shape and the neckline located near 0.6940.
The key technical levels can be examined in greater detail on the daily chart.
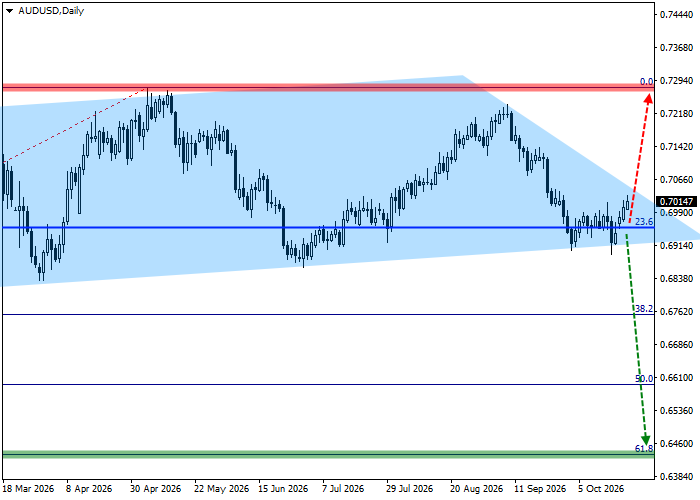
As shown on the chart, the price remains within a channel with dynamic boundaries at 0.7350–0.6930, forming a potential head-and-shoulders reversal structure. The pair has not yet confirmed a decisive break below support, but such a move could develop in the near term. If AUD/USD reaches the target area near 0.6430, corresponding to the 61.8% Fibonacci retracement level, traders may consider taking profits on existing short positions.
The area around the yearly high of 0.7280 represents a key invalidation level for the bearish scenario. A recovery toward this mark would either cancel the broader downward outlook or substantially delay its development, making it reasonable to reconsider existing short positions.
More precise trade entry levels can be assessed on the four-hour chart.
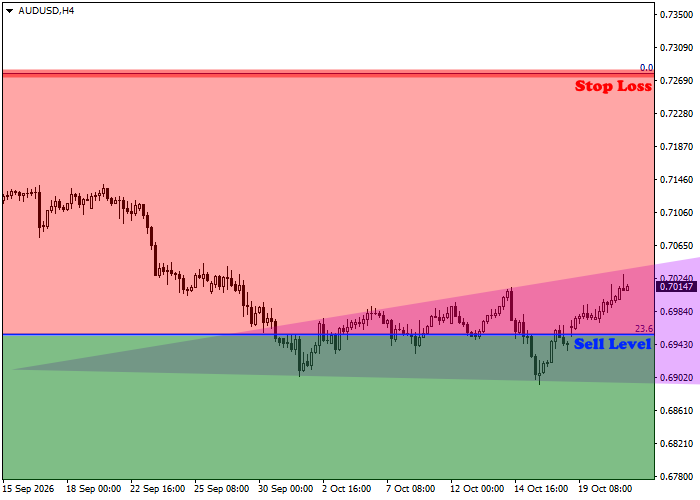
The proposed entry level for short positions is located near 0.6950, close to the 23.6% Fibonacci retracement. A sustained break below the local channel this week could provide a technical signal for opening short positions, with the broader downside target remaining at 0.6430.
Average daily volatility in AUD/USD has declined to approximately 38.6 pips over the past month. The original trading scenario estimates that a move toward the 0.6430 target could take around 58 trading sessions, potentially shortening to approximately 47 sessions if volatility increases. These time estimates remain uncertain and should not be treated as a reliable prediction based on volatility alone.
