

The decline reflects reduced expectations of an imminent tightening of monetary policy by the US Federal Reserve. Earlier, analysts had anticipated interest rate increases in both October and December after September's consumer price index reached 3.7% and the producer price index rose by 6.3% year-on-year. However, recent comments from Fed officials have indicated a more cautious approach as policymakers assess the impact of previous measures on the US economy. Markets now largely expect the central bank to keep rates unchanged in October, with another increase more likely in December. The outlook could change if a renewed escalation of the US-Iran conflict pushes oil prices significantly higher. Meanwhile, the latest US labour market figures showed that initial jobless claims fell to 194.0K in the week ending October 17, below expectations of 200.0K, while continuing claims increased to 1.728 million. The mixed figures suggest that layoffs remain limited, although finding new employment has become somewhat more difficult.
Nevertheless, the current decline is unlikely to reverse the broader upward trend, as the Swiss National Bank (SNB), unlike the Federal Reserve, is not expected to raise borrowing costs this year. According to the SNB's September monetary policy assessment, the regulator kept its benchmark interest rate unchanged at 0.0%, as inflationary pressures in Switzerland remain relatively contained despite higher energy costs. In September, annual consumer inflation accelerated from 0.8% to 1.0%, remaining within the central bank's price stability range of 0.0–2.0%.
Support and resistance levels
The trading instrument is approaching 0.8178 (Murray level [6/8]). A sustained break below this mark could extend the decline toward 0.8056 (Murray level [4/8], lower boundary of the ascending channel) or 0.7995 (Murray level [3/8], 23.6% Fibonacci retracement). However, if the price breaks back above the middle Bollinger Band at 0.8300 (Murray level [8/8]), a renewed advance toward 0.8422 (Murray level [+2/8], 50.0% Fibonacci retracement) and 0.8600 (61.8% Fibonacci retracement) becomes possible.
Technical indicators are providing mixed signals: the Bollinger Bands are flattening after an upward movement, the MACD histogram is preparing to enter negative territory, while the Stochastic oscillator has reached the oversold zone and may reverse upward.
Resistance levels: 0.8300, 0.8422, 0.8600.
Support levels: 0.8178, 0.8056, 0.7995.
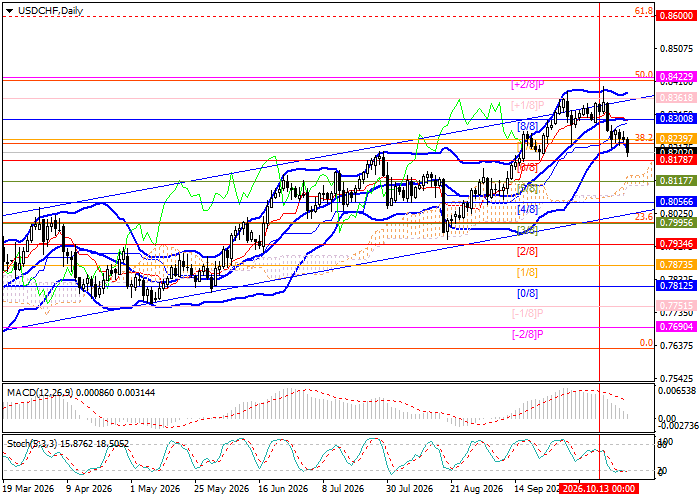
USD/CHF Trading Scenarios and Exchange Rate Forecast
Short positions may be opened below 0.8178, with targets at 0.8056 and 0.7995 and a stop-loss at 0.8260. Estimated implementation period: 5–7 days.
Long positions may be opened above 0.8300, with targets at 0.8422 and 0.8600 and a stop-loss at 0.8210.
Scenario
| Timeframe | Weekly |
| Recommendation | SELL STOP |
| Entry Point | 0.8178 |
| Take Profit | 0.8056, 0.7995 |
| Stop Loss | 0.8260 |
| Key Levels | 0.7995, 0.8056, 0.8178, 0.8300, 0.8422, 0.8600 |
Alternative Scenario
| Recommendation | BUY STOP |
| Entry Point | 0.8300 |
| Take Profit | 0.8422, 0.8600 |
| Stop Loss | 0.8210 |
| Key Levels | 0.7995, 0.8056, 0.8178, 0.8300, 0.8422, 0.8600 |
