

This week marks the beginning of one of the most important corporate earnings periods of the year, and results from major financial institutions have so far been mixed. Bank of America Corp., one of the largest US banks, reported revenue of $30.00 billion compared with forecasts of $30.58 billion, while adjusted earnings per share (EPS) came in at $1.08 versus the expected $1.10. Reported EPS under GAAP amounted to $0.91, reflecting a $1.2 billion regulatory settlement charge. In contrast, Morgan Stanley posted revenue of $20.34 billion and EPS of $3.03, exceeding estimates of $19.96 billion and $2.94, respectively. Investment management company BlackRock Inc. also beat expectations, reporting revenue of $7.75 billion and adjusted EPS of $15.93, compared with forecasts of $7.44 billion and $14.30, respectively.
The US Treasury market is experiencing a sustained decline in yields, with returns across most maturities retreating from multi-year highs. The yield on widely followed short-term one-year Treasury securities remained almost unchanged at 4.485%, compared with 4.482% last week. Meanwhile, the benchmark 10-year Treasury yield declined from 5.271% on Friday to 5.104%, the yield on long-term 20-year bonds fell from 5.660% to 5.501%, and the 30-year yield decreased from 5.602% to 5.455%. As discussed in our previous Nasdaq 100 forecast, Treasury yield dynamics remain an important factor influencing technology stocks.
The leading gainers in the index were Moderna Inc. (+4.65%), Gilead Sciences Inc. (+3.80%), Walmart Inc. (+3.46%), Regeneron Pharmaceuticals Inc. (+3.35%) and Amgen Inc. (+3.21%).
The biggest declines were recorded by CoreWeave Inc. (–15.46%), Nebius Group N.V. (–10.08%), Lumentum Holdings Inc. (–9.28%), Marvell Technology Inc. (–8.72%) and Rocket Lab Corp. (–7.85%).
Support and resistance levels
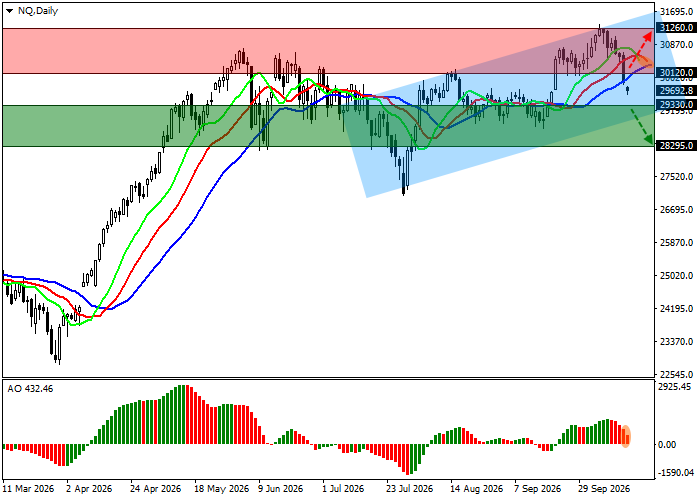
On the daily chart, the trading instrument is retreating from the resistance line of the ascending channel with boundaries at 31700.0–29100.0.
Technical indicators maintain an unstable buy signal: the fast exponential moving averages (EMAs) of the Alligator indicator remain above the slow ones, while the Awesome Oscillator (AO) histogram is forming corrective bars and approaching the zero line.
Support levels: 29330.0, 28295.0.
Resistance levels: 30120.0, 31260.0
Nasdaq 100 Trading Scenarios and Price Forecast
Short positions may be opened after the price declines and consolidates below 29330.0, with a target at 28295.0. Stop-loss: 30000.0. Estimated implementation period: 7 days or more.
Long positions may be opened after the price rises and consolidates above 30120.0, with a target at 31260.0. Stop-loss: 29500.0.
Scenario
| Timeframe | Weekly |
| Recommendation | SELL STOP |
| Entry Point | 29330.0 |
| Take Profit | 28295.0 |
| Stop Loss | 30000.0 |
| Key Levels | 28295.0, 29330.0, 30120.0, 31260.0 |
Alternative Scenario
| Recommendation | BUY STOP |
| Entry Point | 30120.0 |
| Take Profit | 31260.0 |
| Stop Loss | 29500.0 |
| Key Levels | 28295.0, 29330.0, 30120.0, 31260.0 |
