

Japan's stock market remains sensitive to fluctuations in government bond yields and relatively limited movements in the national currency. The index's performance also depends heavily on the yen and the latest macroeconomic data, which confirmed that Japan continued to record a trade deficit in September. Exports increased by 16.7% year-on-year, slowing from 19.3% in August and falling short of analysts' expectations of 20.1%. Imports rose by 18.9% from a year earlier, compared with 28.0% in August and forecasts of 19.6%. As a result, the trade balance recorded a deficit of 536.6 billion yen, narrower than the previous month's 1.11 trillion yen but wider than the expected 181.0 billion yen. According to a Reuters survey, most economists expect the Bank of Japan to raise its policy rate to 1.50% in December, following earlier increases in June and September. Analysts also anticipate at least two additional rate hikes in 2027, potentially bringing borrowing costs to around 2.00% by the middle of the year. The influence of bond yields and monetary policy expectations on the Japanese stock market was also discussed in our previous Nikkei 225 forecast.
Expectations of further monetary tightening continue to influence Japan's government bond market, although yields have declined since the end of last week. According to the market snapshot, the benchmark 10-year Japanese government bond yield has decreased from 2.941% to 2.891%, while the yield on 20-year securities has fallen from 3.814% to 3.669%. The yield on longer-term 30-year bonds has also declined, reaching 3.923% compared with 4.048% previously.
Among the stocks showing gains in the market snapshot were Sumitomo Pharma Co. Ltd. (+3.74%), Mitsui Kinzoku Co. Ltd. (+3.88%), Resonac Holdings Corp. (+4.40%), Fujikura Ltd. (+4.03%) and Resona Holdings Inc. (+3.29%).
Stocks under pressure included SHIFT Inc. (–2.42%), Yaskawa Electric Corp. (–1.54%), Sapporo Breweries Ltd. (–1.95%), Dentsu Inc. (–1.59%) and Shiseido Co. Ltd. (–2.17%).
Support and resistance levels
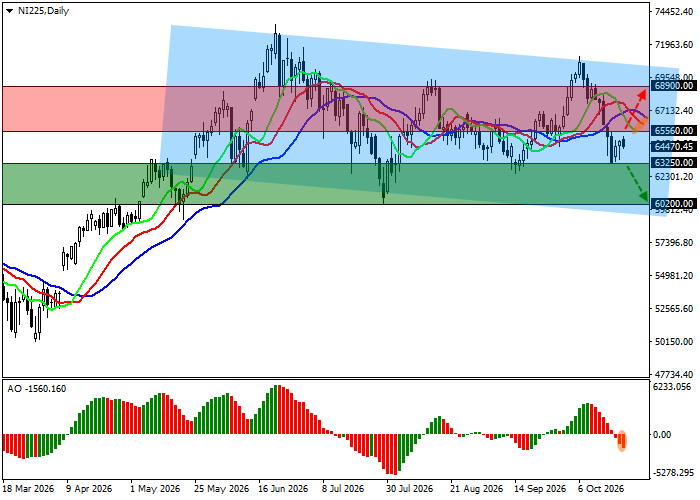
On the daily chart, the trading instrument is declining from the resistance line of a local descending channel with dynamic boundaries at 70000.0–60000.0.
Technical indicators have generated a sell signal: the Awesome Oscillator (AO) histogram is forming corrective bars, while the fast exponential moving averages (EMAs) of the Alligator indicator continue to move lower, remaining below the slow ones and gradually widening their spread.
Support levels: 63250.0, 60200.0.
Resistance levels: 65560.0, 68900.0.
Nikkei 225 Trading Scenarios and Index Forecast
Short positions may be opened after the price declines and consolidates below 63250.0, with a target at 60200.0. Stop-loss: 64000.0. Estimated implementation period: 7 days or more. Long positions may be opened after the price rises and consolidates above 65560.0, with a target at 68900.0. Stop-loss: 64500.0.
Scenario
| Timeframe | Weekly |
| Recommendation | SELL STOP |
| Entry Point | 63250.0 |
| Take Profit | 60200.0 |
| Stop Loss | 64000.0 |
| Key Levels | 60200.0, 63250.0, 65560.0, 68900.0 |
Alternative Scenario
| Recommendation | BUY STOP |
| Entry Point | 65560.0 |
| Take Profit | 68900.0 |
| Stop Loss | 64500.0 |
| Key Levels | 60200.0, 63250.0, 65560.0, 68900.0 |
