
In the first quarter, there were 2.5 unemployed persons per vacancy — a figure unchanged since the third quarter of last year. The estimated employment rate was little changed year-on-year but rose 0.1 percentage point to 75.0% quarter-on-quarter, while the unemployment rate increased 0.5 percentage points on the year and fell 0.2 percentage points to 5.0% on the quarter. The economic inactivity rate declined 0.4 percentage points year-on-year and rose 0.1 percentage points to 20.9% quarter-on-quarter. On the vacancies front, job openings are expected to have fallen by 28,000 between February and April to 705,000 — the lowest level since 2021. April's Consumer Price Index, however, provided a degree of relief: while it rose to 0.7% month-on-month and 2.8% year-on-year, the annual reading came in well below the 3.3% forecast, with the core reading at 0.7% and 2.5% against an expected 3.1%.
The US dollar is pulling back to 99.20 on the USDX as concerns over a Middle East escalation persist. Reports emerged yesterday that Iran has submitted a new peace settlement proposal to the United States, which would involve reopening the Strait of Hormuz in exchange for compensation for damages sustained and a full withdrawal of US forces from the region. Analysts have been broadly skeptical of the offer, noting that it closely resembles a previous proposal already criticized by President Trump. Meanwhile, the Senate passed a procedural vote for the first time in support of a resolution that would effectively instruct the White House to halt military operations against Iran — with 50 senators voting in favor and 47 against. The upper chamber had previously rejected the measure seven times. The Hill notes that even if the resolution passes both the Senate and the House, Trump is expected to veto it. Of greater interest to investors is the revelation that US authorities are now examining market activity around the President's morning social media posts: the CFTC has launched an inquiry into a surge of $800 million in oil market trading that occurred immediately before Trump's post announcing the suspension of strikes on Iran — reviving earlier concerns raised by analysts about potential insider trading.
Support and Resistance Levels
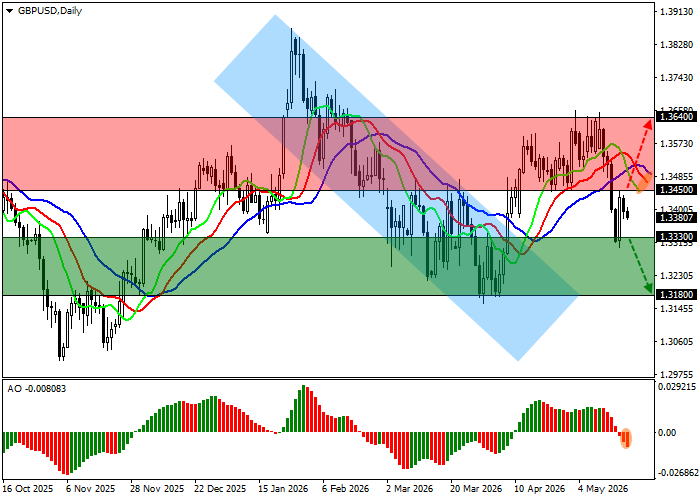
On the daily chart, the pair is holding above the support line of an ascending channel with dynamic boundaries at 1.3650–1.3350.
Technical indicators are reinforcing an unstable sell signal: the Alligator's fast EMAs are below the signal line and moving further away from it, while the Awesome Oscillator histogram is forming descending bars and declining deeper into negative territory.
Resistance levels: 1.3450, 1.3640.
Support levels: 1.3330, 1.3180.
GBP/USD Trading Scenarios and Price Forecast
Short positions can be opened after the price declines and consolidates below 1.3330, targeting 1.3180, with a stop-loss at 1.3430. Time horizon: 7 days or more. Long positions can be opened after the price rises and consolidates above 1.3450, targeting 1.3640, with a stop-loss at 1.3370.
| Scenario | |
|---|---|
| Timeframe | Weekly |
| Recommendation | SELL STOP |
| Entry Point | 1.3325 |
| Take Profit | 1.3180 |
| Stop Loss | 1.3430 |
| Key Levels | 1.3180, 1.3330, 1.3450, 1.3640 |
| Alternative Scenario | |
|---|---|
| Recommendation | BUY STOP |
| Entry Point | 1.3455 |
| Take Profit | 1.3640 |
| Stop Loss | 1.3370 |
| Key Levels | 1.3180, 1.3330, 1.3450, 1.3640 |
