
The key event of the day will be the release of April inflation data, where the Consumer Price Index is expected to ease from 1.3% to 1.0% month-on-month while holding around 3.0% year-on-year, with the core reading — excluding food and energy — expected to remain at 0.9% and 2.2% respectively. An acceleration in price growth would be a decisive factor for ECB officials when considering a return to hawkish monetary policy at upcoming meetings.
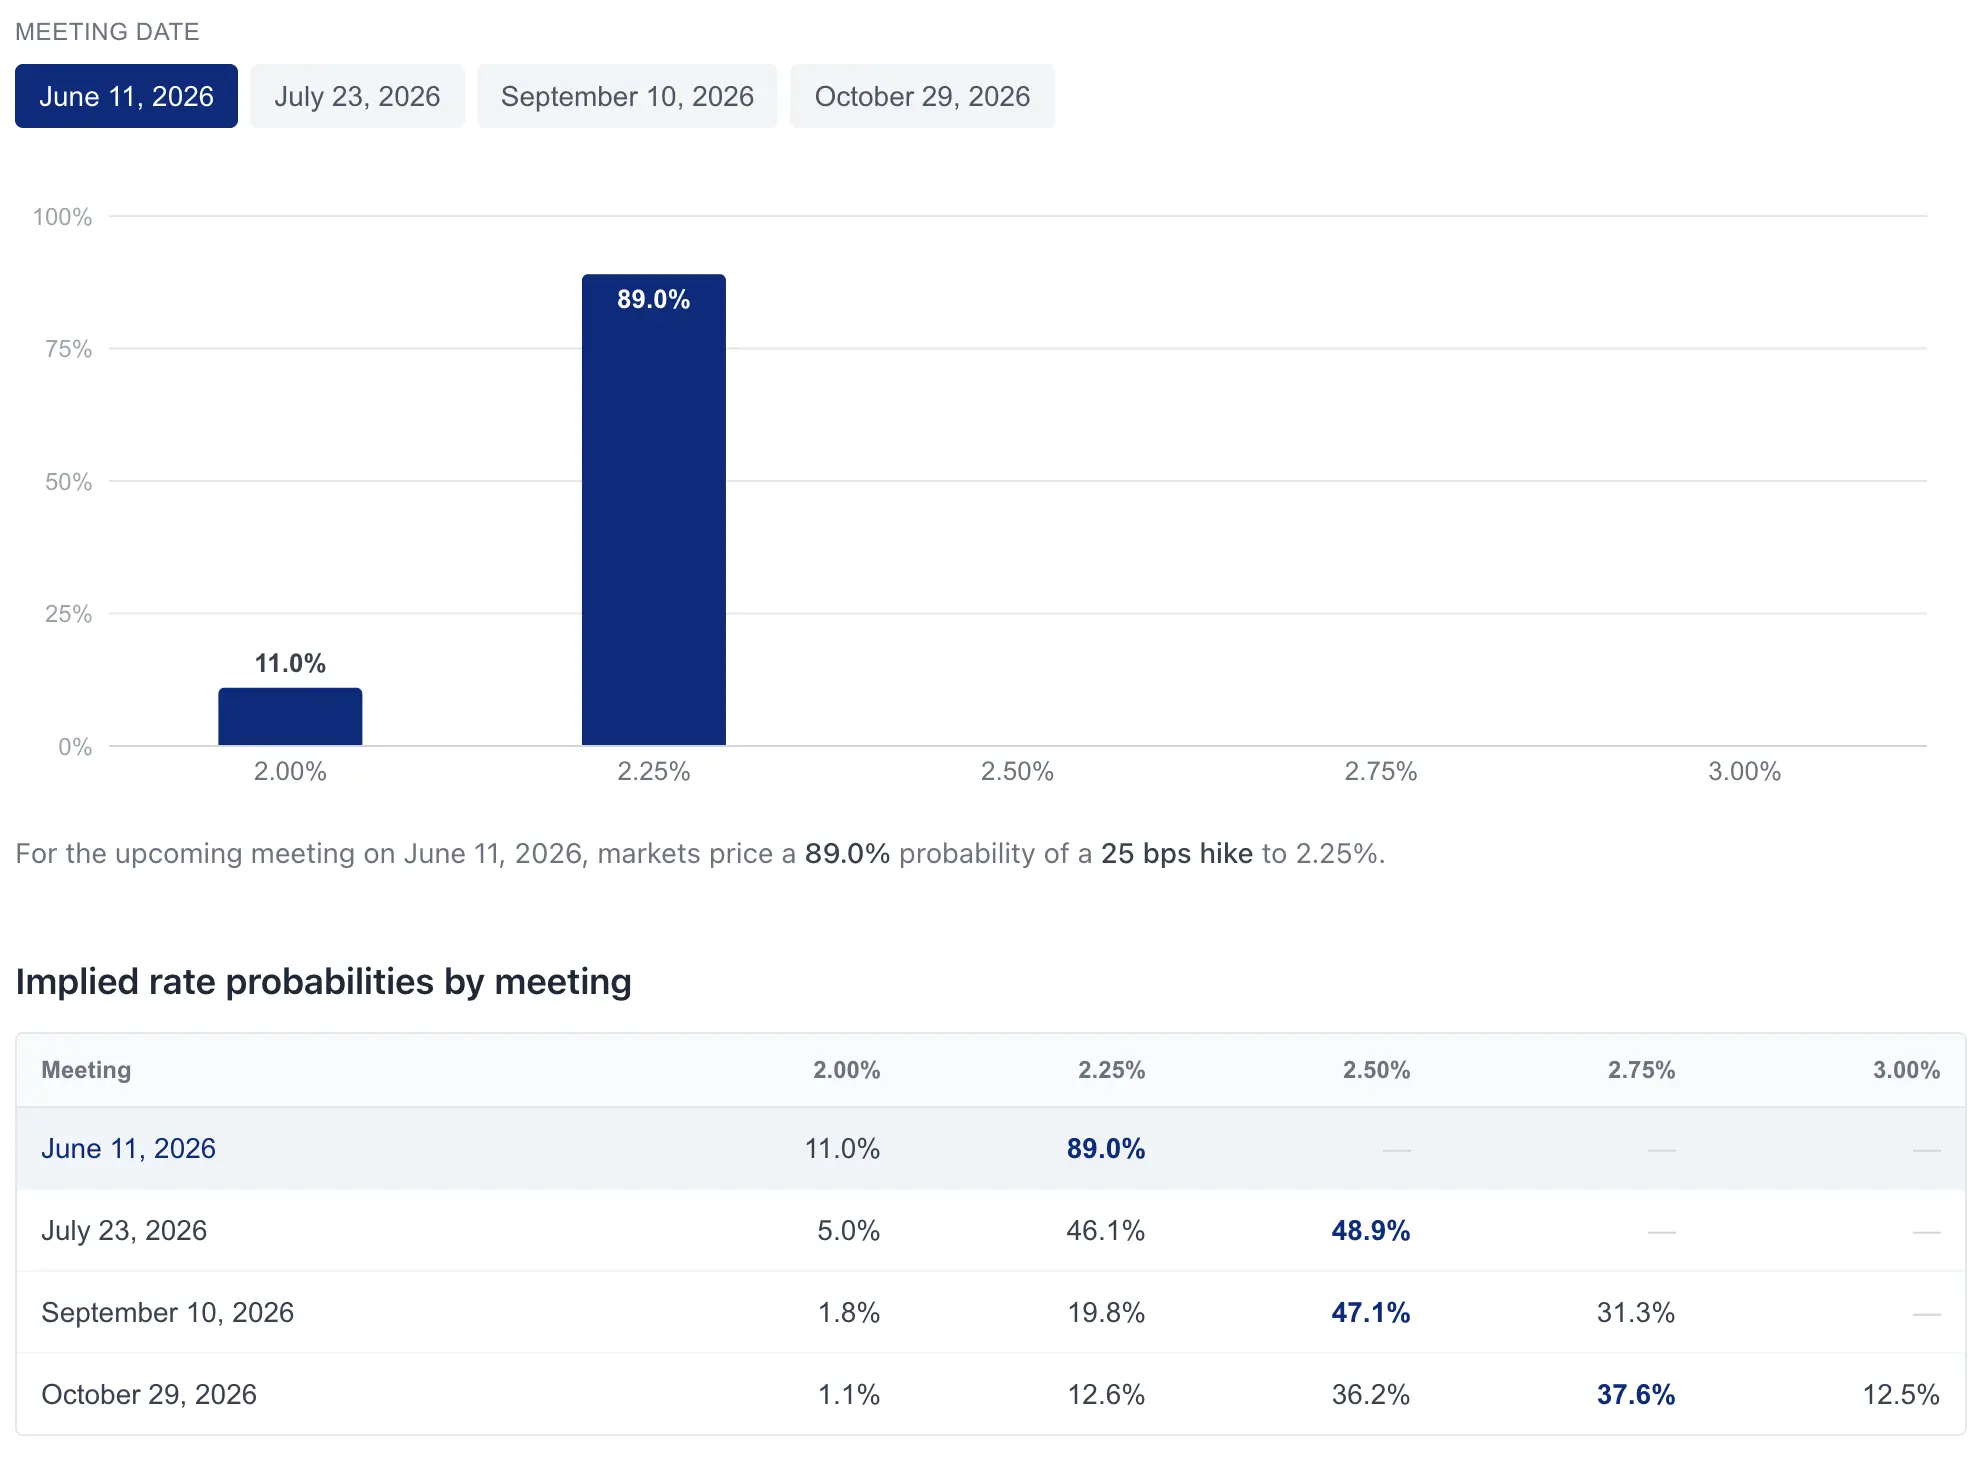
Already, according to the ECB Watch Tool, market participants are pricing in a 90.0% probability of a 25 basis point rate hike to 2.25% at the June meeting, with at least one further adjustment expected before year-end.
Governing Council members — including Bank of Latvia Governor Martins Kazaks and Bank of Greece Governor Yannis Stournaras — have stated that the central bank will be compelled to raise borrowing costs if rising energy prices begin to feed through into inflation expectations. Analysts at ING Group, however, caution that current market pricing appears excessive and that policymakers are unlikely to actively push back against this trend until there are clear signals that the Strait of Hormuz is reopening. This factor, combined with the ECB's limited options other than maintaining a hawkish stance to avoid losing control of the yield curve, is preventing a deeper decline in the euro. The broader macroeconomic picture from the eurozone remains predictably weak: first-quarter GDP grew just 0.1% quarter-on-quarter with the annual rate slowing to 0.8%, industrial production contracted 0.9% month-on-month in March and fell 2.1% year-on-year, while eurozone consumer confidence has dropped to its lowest level since the COVID-19 pandemic lockdowns.
Meanwhile, the current state of negotiations between the European Commission and the White House reflects an escalation of institutional uncertainty within the transatlantic trade architecture established under the bilateral agreement signed on August 21, 2025. The baseline terms envisaged a unified tariff regime with a 15.0% cap on import duties covering significant volumes of European exports, alongside parallel liberalization of US goods access to the EU market — but implementation has been fragmented at best. The US has expanded the application of 50.0% tariffs on European steel and aluminum, as well as on select high-value-added product categories, effectively undermining part of the original compromise. With total annual EU–US trade estimated at $1.2–1.6 trillion, tariff parameters carry critical weight for export-oriented European industries including automotive, metals, and chemicals. The European Commission is pushing to conclude an agreement ahead of the July 4 deadline, while the Republican administration retains the option of escalating the trade war — including a potential increase in auto tariffs from 15.0% to 25.0% — which would significantly impact the competitiveness of European exports in a key market.
For US investors, today's focal point at 20:00 (GMT+2) will be the Federal Reserve's April monetary policy meeting minutes, which may once again reveal a lack of consensus within the institution. At the April 29 meeting, the interest rate was held in the 3.50–3.75% range, but participants highlighted concerns about the prolongation of the Middle East crisis — which could significantly weaken the US labor market and necessitate rate cuts — while elevated oil prices are acting as a catalyst for accelerating inflation and may require more decisive steps toward monetary tightening.
Support and Resistance Levels
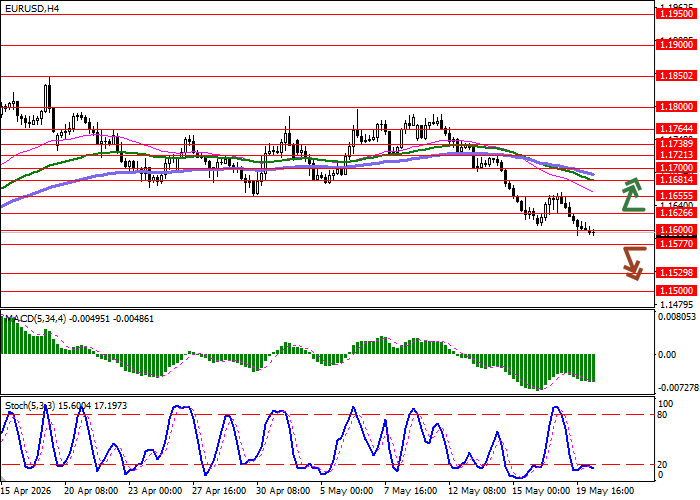
On the daily chart, the Bollinger Bands are showing a moderate decline, with the price range expanding actively but unable to keep pace with the current burst of bearish momentum. The MACD is maintaining a firm sell signal below the signal line. The Stochastic, having bounced from its lows at the start of the week, is attempting to turn upward — traders should wait for a clearer signal from the indicator before acting.
Resistance levels: 1.1626, 1.1655, 1.1681, 1.1700.
Support levels: 1.1600, 1.1577, 1.1529, 1.1500.
EUR/USD Trading Scenarios and Price Forecast
Short positions can be opened after a confirmed downside breakout of 1.1577, targeting 1.1500, with a stop-loss at 1.1620. Time horizon: 1–2 days. A return of bullish momentum followed by an upside breakout of 1.1626 may serve as a signal to open long positions targeting 1.1681, with a stop-loss at 1.1600.
| Scenario | |
|---|---|
| Timeframe | Intraday |
| Recommendation | SELL STOP |
| Entry Point | 1.1575 |
| Take Profit | 1.1500 |
| Stop Loss | 1.1620 |
| Key Levels | 1.1500, 1.1529, 1.1577, 1.1600, 1.1626, 1.1655, 1.1681, 1.1700 |
| Alternative Scenario | |
|---|---|
| Recommendation | BUY STOP |
| Entry Point | 1.1630 |
| Take Profit | 1.1681 |
| Stop Loss | 1.1600 |
| Key Levels | 1.1500, 1.1529, 1.1577, 1.1600, 1.1626, 1.1655, 1.1681, 1.1700 |
