

Geopolitical tensions in the Middle East continue to function as a key systemic factor for global energy and inflation expectations. The hawkish rhetoric from conflict participants and the absence of meaningful progress in negotiations are sustaining a persistent regime of uncertainty, in which the risk of supply disruptions through the Strait of Hormuz remains elevated — equivalent to a shortfall of 20.0–25.0% of global oil volumes previously transported through this critical maritime chokepoint. As a result, prices are holding above $100.0 per barrel for leading grades including Brent Crude, reinforcing inflationary pressure. In the United States, the Consumer Price Index eased from 0.9% to 0.6% month-on-month but rose from 3.3% to a three-year peak of 3.8% year-on-year — above the expected 3.7% — while the core reading accelerated from 0.2% to 0.4% against a 0.3% forecast and from 2.6% to 2.8% versus the expected 2.7%. These figures significantly exceed the Fed's 2.0% target and are driving a shift in expectations toward a more hawkish stance on monetary policy adjustments. Even with a change in leadership at the central bank, its course will continue to be shaped by the evolution and ultimate outcome of the US–Iran confrontation. New Fed Chair Kevin Warsh will be sworn in on Friday at the White House, succeeding Jerome Powell, whose eight-year term officially ended on May 15 — though Powell plans to remain on the Board of Governors until he is satisfied that the criminal investigation launched by the Republican administration over alleged misuse of funds during the renovation of the Fed's Washington headquarters has been fully concluded. In this environment, the bond market is seeing yields anchored at multi-year highs: 10-year Treasury yields have reached 4.663% — the highest since April 2024 and echoing levels seen before the 2008 financial crisis. Taken together, these factors are creating a regime of heightened financial system sensitivity to supply shocks, while simultaneously leaving limited room for monetary easing in the medium term.
The decline in gold trading activity can be tracked through data from leading commodity exchanges. According to the CME, current trading volumes are roughly in line with last week's levels, but the composition is shifting toward options positions — a sign of significant uncertainty about the direction of the trend. On May 18, just 188,500 futures positions and 51,700 options positions were recorded: while the futures figure is one of the lowest readings of the month, the options figure is conversely one of the highest, pointing to elevated hedging activity.
Support and Resistance Levels
On the daily chart, price is holding just below the resistance line of a descending channel with dynamic boundaries at 4,700.0–4,000.0.
Technical indicators are maintaining an unstable sell signal that has been unable to strengthen during the local correction: the Alligator's fast EMAs remain below the signal line, while the Awesome Oscillator histogram is forming new corrective bars below the zero level.
Support levels: 4,380.0, 4,010.0.
Resistance levels: 4,570.0, 4,890.0.
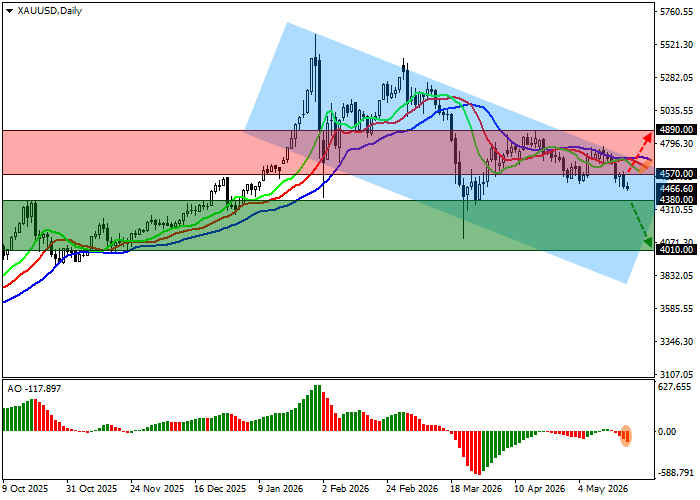
XAU/USD Trading Scenarios and Gold Price Forecast
Short positions can be opened after the price declines and consolidates below 4,380.0, targeting 4,010.0, with a stop-loss at 4,500.0. Time horizon: 7 days or more.
Long positions can be opened after the price rises and consolidates above 4,570.0, targeting 4,890.0, with a stop-loss at 4,470.0.
| Scenario | |
|---|---|
| Timeframe | Weekly |
| Recommendation | SELL STOP |
| Entry Point | 4,379.5 |
| Take Profit | 4,010.0 |
| Stop Loss | 4,500.0 |
| Key Levels | 4,010.0, 4,380.0, 4,570.0, 4,890.0 |
| Alternative Scenario | |
|---|---|
| Recommendation | BUY STOP |
| Entry Point | 4,570.5 |
| Take Profit | 4,890.0 |
| Stop Loss | 4,470.0 |
| Key Levels | 4,010.0, 4,380.0, 4,570.0, 4,890.0 |
