

Experts link this performance to the strengthening decentralised finance (DeFi) market and the growing popularity of tokenised equities. At present, more than 80.0% of such assets are issued on the Solana blockchain due to its high speed and ease of use. As trading activity in the segment increased, with weekly volume exceeding USD 2.5 billion according to RWA.xyz, up tenfold from the previous month, the SOL token has received substantial support. Additional investor interest has also been driven by the recent decision of payment company MoneyGram International Inc. to join the Solana network as a validator. The company will now process transactions on the blockchain and may become part of its wider infrastructure in the future.
Nevertheless, the asset’s positive dynamics appear unstable, as medium-term fundamental factors remain negative for the entire sector. In particular, incoming macroeconomic data are increasing the likelihood of further monetary tightening by the US Federal Reserve. Inflation remains significantly above the regulator’s target, reaching 4.2% in headline terms and 2.9% in core terms in May, while first-quarter gross domestic product (GDP) reached 2.1% versus expectations of 1.6%. Labour-market data will be released tomorrow at 14:30 (GMT+2), and if forecasts of unemployment remaining at 4.3% and nonfarm payrolls rising to 114,000 are confirmed, the probability of an interest-rate increase by September could rise further from the current 80.0% indicated by the CME FedWatch Tool. In addition, investors are concerned about a statement from Strategy Inc., the largest public BTC holder, regarding its intention to sell more than 1.0 billion tokens to strengthen its financial position. The risk of such a large volume of the leading cryptocurrency entering the market is weighing on all digital assets, and a medium-term reversal lower in SOL/USD cannot be ruled out.
Support and Resistance Levels
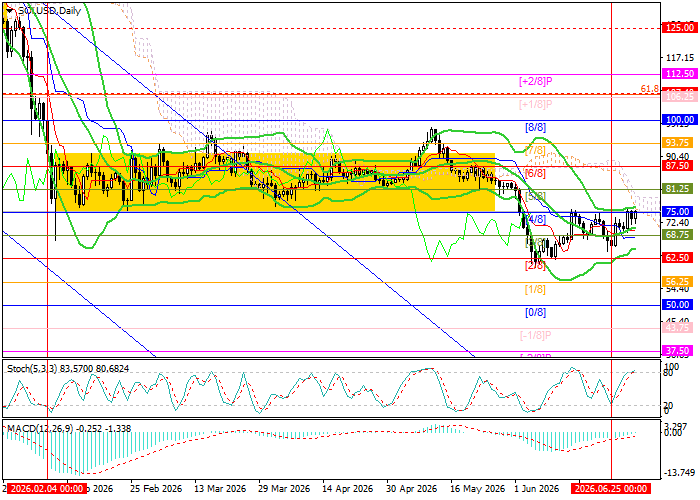
The trading instrument is testing 75.00 (Murray level [4/8]). A sustained move above this level could allow it to rise toward 87.50 (Murray level [6/8]) and 93.75 (Murray level [7/8]). However, if the price breaks below the lower Bollinger Band at 62.50 (Murray level [2/8]), a renewed decline toward 50.00 (Murray level [0/8]), 43.75 (Murray level [–1/8]), and 37.50 (Murray level [–2/8]) is expected.
Technical indicators do not provide a unified signal. Bollinger Bands are moving upward, the MACD histogram is preparing to enter positive territory, while the Stochastic oscillator has reached overbought territory and may turn downward.
Resistance levels: 75.00, 87.50, 93.75.
Support levels: 62.50, 50.00, 43.75, 37.50.
SOL/USD Trading Scenarios and Price Forecast
Long positions may be considered above 75.00, with targets at 87.50 and 93.75 and a stop-loss at 65.00. Expected implementation period: 5–7 days. Short positions may be considered below 62.50, with targets at 50.00, 43.75, and 37.50 and a stop-loss at 70.00.
Scenario
| Timeframe | Weekly |
| Recommendation | BUY STOP |
| Entry Point | 75.90 |
| Take Profit | 87.50, 93.75 |
| Stop Loss | 65.00 |
| Key Levels | 37.50, 43.75, 50.00, 62.50, 75.00, 87.50, 93.75 |
Alternative Scenario
| Recommendation | SELL STOP |
| Entry Point | 62.30 |
| Take Profit | 50.00, 43.75, 37.50 |
| Stop Loss | 70.00 |
| Key Levels | 37.50, 43.75, 50.00, 62.50, 75.00, 87.50, 93.75 |
