Ethereum's staking exit queue increased more than fivefold in just three days, reaching a peak of around 851,000 ETH after MetaMask began proactively withdrawing thousands of validators following a security incident.
BitMine Immersion Technologies announced in mid-April that its Ethereum reserves had reached 4.875 million tokens. This equals approximately 4.04% of the current circulating ETH supply, which is estimated at 120.7 million coins. As a result, BitMine has become one of the largest known Ethereum holders in the world.
SOL/USD remains trapped in the sideways range of 75.00–91.00, despite the recovery seen across most leading crypto assets, which analysts primarily link to hopes for a peaceful resolution of the Middle East crisis. A confirmed move below the lower boundary at 75.00 (Murray [0/8]) would act as a catalyst for stronger bearish momentum and open the way toward 68.75 (Murray [–2/8]) and 62.50 (Murray [2/8], W1). On the other hand, a breakout above 91.00 would resume the upward movement toward 100.00 (Murray [8/8]), 107.40 (Fibonacci retracement 61.8%), and 125.00 (Murray [4/8], W1).
Worldcoin (WLD) has once again moved into the market spotlight, posting a solid advance shortly before the announced “Lift Off” event scheduled for April 17. Additional interest in the token is being driven not only by expectations surrounding the launch of World ID, but also by a noticeable improvement in the short-term technical picture.
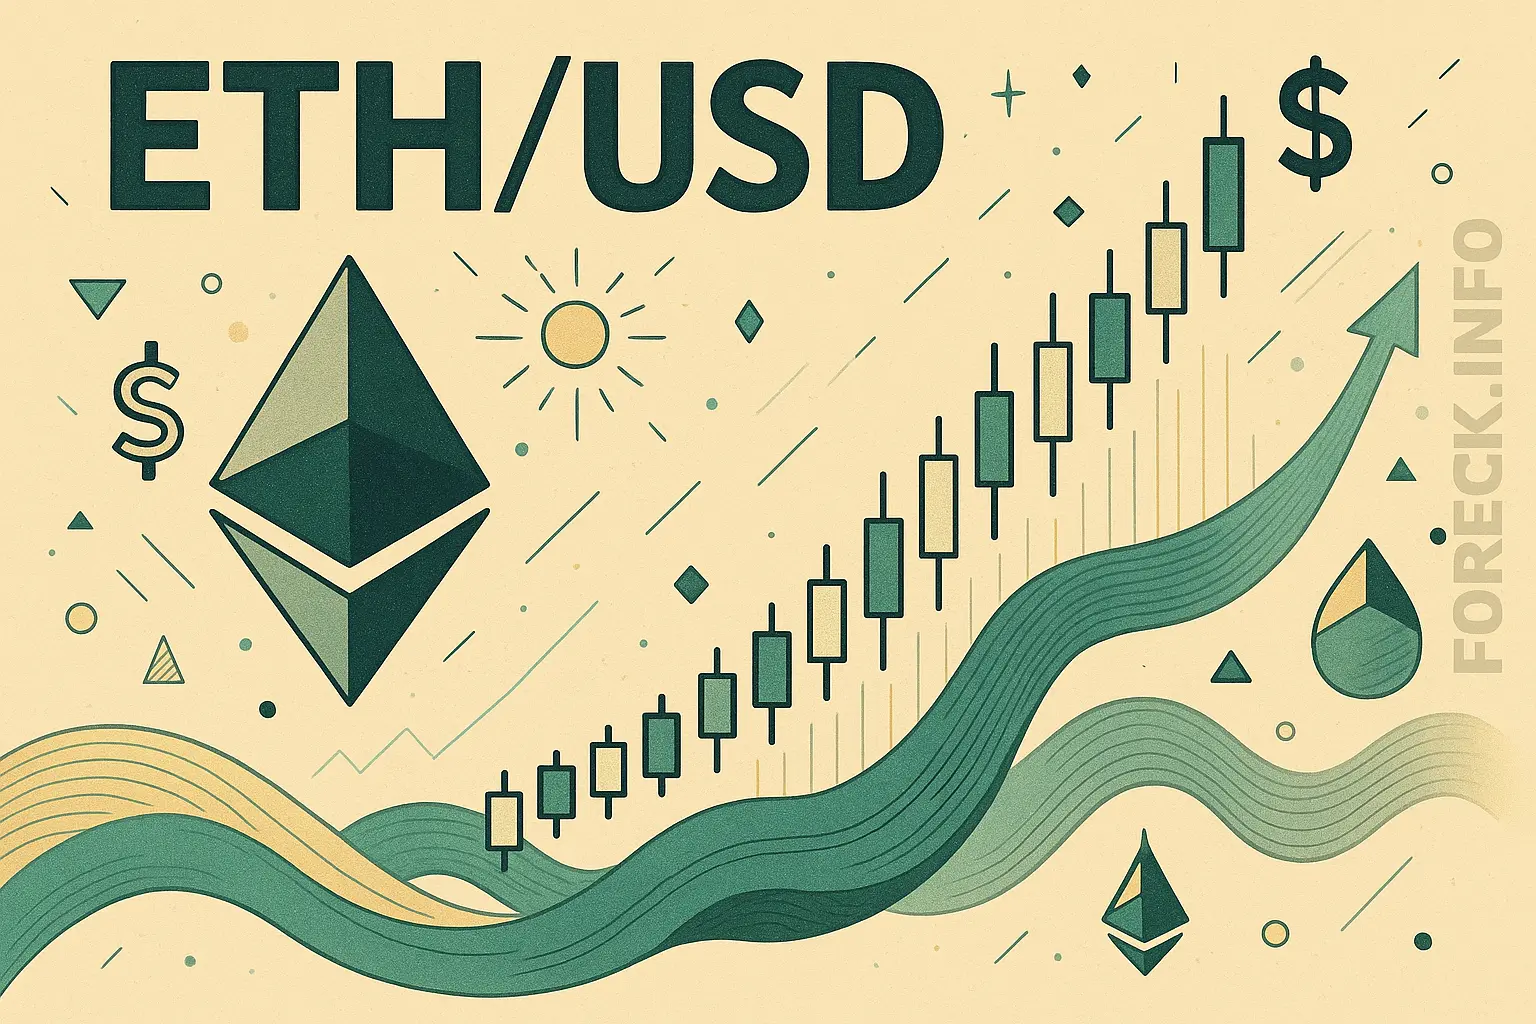
This week, ETH/USD resumed its upward movement in line with the broader market trend: the pair has exited the long-term descending channel by breaking above its upper boundary and is now testing the 2375.00 level (Murray [3/8]), attempting to reverse the previous direction of movement. However, for the bullish momentum to continue, the price needs to consolidate above 2500.00 (Murray [4/8], the middle Bollinger Band on W1). A breakout above this mark would give buyers an opportunity to test the targets at 2812.50 (Murray [6/8], Fibonacci retracement 61.8%), 3125.00 (Murray [6/8], Fibonacci retracement 50.0%), and 3400.00 (the area of January highs). For the bears, the key level appears to be 2000.00 (below the middle Bollinger Band): a renewed breakout below it could trigger a stronger downward move toward 1750.00 (Murray [–2/8]) and 1481.50 (Fibonacci retracement 100.0%).
As market participants reduce positions and activity remains subdued, more attention is shifting toward the lower support zone. After its recent upward move, ADA is once again losing momentum. The price failed to hold at higher levels, while the broader market structure is becoming more cautious again. Current data provides a clear picture of how traders are positioning themselves and which levels could become decisive in the near term.
At the beginning of the month, the XRP/USD pair attempted to move lower and formed a new narrow sideways range of 1.3671-1.2695 (Murray level [6/8]-[5/8]), where it continues to trade. A breakout below the lower boundary of this range could trigger stronger bearish momentum toward 1.0742 (Murray level [3/8]) and 0.9765 (Murray level [2/8]). For bulls, the key resistance zone remains 1.4648-1.5625 (Murray level [7/8]-[8/8]); a firm breakout above this area would allow the instrument to leave the channel and test targets at 1.7578 (Murray level [+2/8]), 1.9980 (50.0% Fibonacci retracement), and 2.3519 (38.2% Fibonacci retracement).
Easing tensions between the United States and Iran has led to a noticeable recovery in the cryptocurrency market. One of the main beneficiaries has been Zcash, which has outperformed the broader market amid improving investor sentiment.
This week, the ETH/USD pair is rising in line with the broader market trend amid positive geopolitical signals that have increased investor interest in risk assets and allowed the quotes to renew a four-week high at 2270.00.
The SOL/USD pair has remained within a sideways range of 91.00-75.00 for the third month in a row: amid geopolitical and monetary uncertainty, quotations still lack sufficient drivers to determine the direction of further movement.
Algorand is currently among the biggest gainers in the cryptocurrency market. Google Quantum AI’s analysis has played an important role in the current momentum, having already sparked strong reactions around Bitcoin earlier. However, the key question now is how sustainable this rally will be.
Solana (SOL) is once again coming under increasing pressure, with new yearly lows no longer ruled out. This price analysis outlines all key chart levels.
This week, XRP/USD quotes fell below the sideways range of 1.5625–1.3671 (Murray levels [8/8]–[7/8]), where the pair had remained for more than two months. A break below 1.3000 (the area of March lows) may act as a catalyst for further bearish momentum toward targets at 0.9765 (Murray level [5/8]) and 0.7812 (Murray level [4/8]). The resistance zone at 1.5625–1.6420 (Murray level [8/8], Fibonacci retracement 61.8%) remains key for buyers: consolidation above this range may lead to a breakout from the descending channel through its upper boundary and further growth toward 1.9531 (Murray level [+2/8]) and 2.3519 (Fibonacci retracement 38.2%).