

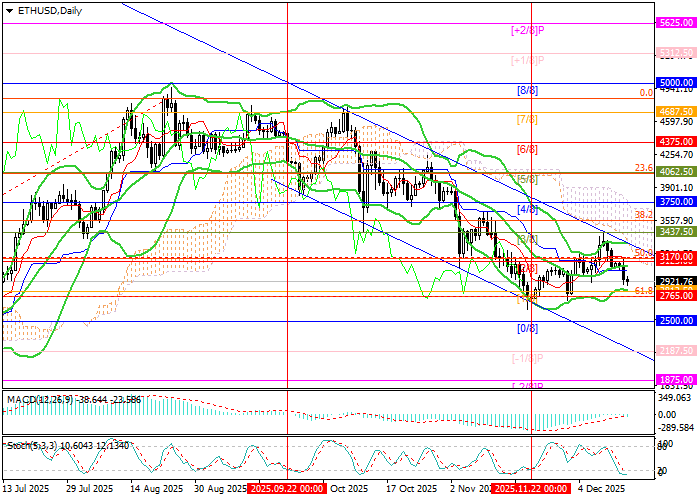
Technical indicators are mixed. Bollinger Bands have shifted into a flat (sideways) configuration, while the MACD histogram is hovering near the zero line with modest volume. At the same time, the Stochastic Oscillator may soon exit oversold territory, which keeps the door open for a short-term rebound. In addition, on the weekly chart Bollinger Bands are also turning lower, hinting at a potential transition away from the long-term uptrend and making the bearish scenario more probable.
Support and Resistance Levels
Resistance: 3437.50, 4062.50, 4687.50.
Support: 2765.00, 2187.50, 1875.00.
Trading Scenarios and ETH/USD Forecast
Short positions can be considered below 2765.00 with targets at 2187.50 and 1875.00, and a stop-loss at 3120.00. Estimated timeframe: 5–7 days.
Long positions can be considered above 3437.50 with targets at 4062.50 and 4687.50, and a stop-loss at 3090.00.
Scenario
| Timeframe | Weekly |
| Recommendation | SELL STOP |
| Entry | 2750.00 |
| Take Profit | 2187.50, 1875.00 |
| Stop Loss | 3120.00 |
| Key Levels | 1875.00, 2187.50, 2765.00, 3437.50, 4062.50, 4687.50 |
Alternative Scenario
| Recommendation | BUY STOP |
| Entry | 3439.00 |
| Take Profit | 4062.50, 4687.50 |
| Stop Loss | 3090.00 |
| Key Levels | 1875.00, 2187.50, 2765.00, 3437.50, 4062.50, 4687.50 |