

Recall that the Fed cut its key interest rate by 25 basis points to 3.75% and announced the start of U.S. Treasury bond purchases totaling $40.0 billion. Crypto investors had largely anticipated this scenario, meaning it was mostly priced in. In addition, policymakers did not provide a clear signal that borrowing costs would continue to fall next year. The “dot plot” confirmed the likelihood of only one rate adjustment over the next 12 months, while Fed Chair Jerome Powell once again emphasized that the regulator may pause active measures to assess the economic impact of decisions already taken. As a result, BTC pulled back toward the lower boundary of the range, where it is currently consolidating.
Investors remain cautious and are reluctant to take on additional risk ahead of the release of U.S. November labor market data tomorrow at 15:30 (GMT+2), as well as upcoming monetary policy decisions from the Bank of Japan and the Bank of England. Overall market sentiment remains rather negative: the Crypto Fear & Greed Index has fallen into the “extreme fear” zone at 16, despite Bitcoin ETFs recording net inflows of $286.6 million last week. It is also worth noting bearish forecasts from Barclays analysts, who expect spot market volumes to decline in 2026 due to a lack of major growth catalysts such as Donald Trump’s U.S. election victory or the launch of fundamentally new exchange products. This could put pressure on platforms like Coinbase and Robinhood. At the same time, Barclays notes that the adoption of the Digital Asset Market Clarity Act, which would define the boundary between digital commodities and securities, could support greater institutional interest in cryptocurrencies—but only over the long term.
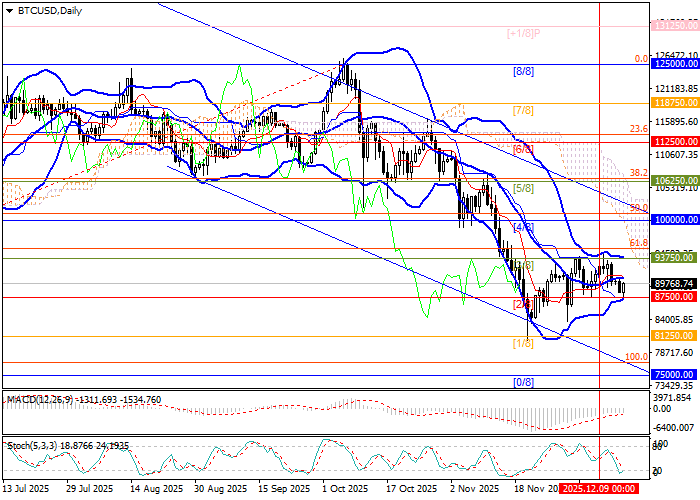
Support and resistance levels
The instrument continues to trade within the sideways range of 93,750.00–87,500.00 (Murray [3/8]–Murray [2/8]) and has yet to break out. A sustained move below the lower boundary would open the way for further downside toward 81,250.00 (Murray [1/8]) and 75,000.00 (Murray [0/8]). Conversely, a breakout above 93,750.00 (Murray [3/8], upper Bollinger Band) would allow prices to resume growth toward 100,000.00 (Murray [4/8]) and 106,250.00 (Murray [5/8]).
Technical indicators remain mixed: Bollinger Bands are moving sideways, MACD is stable in negative territory, while the Stochastic oscillator is turning higher from oversold levels.
Resistance levels: 93,750.00, 100,000.00, 106,250.00.
Support levels: 87,500.00, 81,250.00, 75,000.00.
Trading scenarios and BTC/USD outlook
Short positions can be considered below 87,500.00 with targets at 81,250.00 and 75,000.00, and a stop-loss at 92,600.00. Time horizon: 5–7 days.
Long positions can be considered above 93,750.00 with targets at 100,000.00 and 106,250.00, and a stop-loss at 88,600.00.
Scenario
| Timeframe | Weekly |
| Recommendation | SELL STOP |
| Entry point | 89,200.00 |
| Take Profit | 81,250.00, 75,000.00 |
| Stop Loss | 92,600.00 |
| Key levels | 75,000.00, 81,250.00, 87,500.00, 93,750.00, 100,000.00, 106,250.00 |
Alternative scenario
| Recommendation | BUY STOP |
| Entry point | 92,000.00 |
| Take Profit | 100,000.00, 106,250.00 |
| Stop Loss | 88,600.00 |
| Key levels | 75,000.00, 81,250.00, 87,500.00, 93,750.00, 100,000.00, 106,250.00 |
