

Analysts view the partial recovery in the crypto market as fragile and largely driven by technical factors. Overall, investor sentiment ahead of the Christmas and New Year holidays remains cautious. Contrary to the “holiday rally” pattern seen in recent years, capital is currently rotating out of digital assets, with more attention going to tech equities and especially gold, which has continued to print fresh all-time highs this week. The Fear & Greed Index remains in “extreme fear” territory at 25. Spot ETH ETFs recorded outflows of $643.9 million last week, although inflows resumed on Monday, totaling $84.6 million.
In the near term, fresh signals about the Fed’s next steps could become a catalyst for the next directional move in prices.
Support and resistance levels
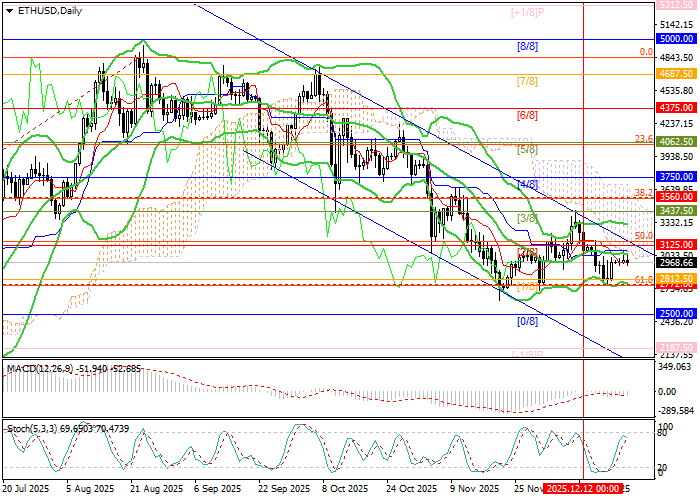
The instrument is forming a medium-term downtrend while correcting toward the long-term upward trend; the price is currently near the upper boundary of the descending channel. If quotes break above the Bollinger Bands’ middle line and the 3125.00 level (Murrey [2/8], Fibonacci 50.0% retracement), they may exit the channel and extend gains toward 3560.00 (Fibonacci 50.0% retracement) and 3750.00 (Murrey [4/8]). The key level for bears remains 2812.50 (Murrey [1/8]); a downside break would likely resume the decline toward 2500.00 (Murrey [0/8]) and 2187.50 (Murrey [–1/8]).
Technical indicators are mixed: Bollinger Bands have turned sideways, MACD is stable in negative territory, and Stochastic may soon roll over lower from the overbought zone.
It is also worth noting that on the weekly chart Bollinger Bands are turning down, signaling a possible shift in the long-term uptrend, which makes the downside scenario more favorable.
Resistance levels: 3125.00, 3560.00, 3750.00.
Support levels: 2812.50, 2500.00, 2187.50.
Trading scenarios and ETH/USD outlook
Short positions could be opened below 2812.50 with targets at 2500.00 and 2187.50 and a stop-loss at 3010.00. Timeframe: 5–7 days.
Long positions could be opened above 3125.00 with targets at 3560.00 and 3750.00 and a stop-loss at 2880.00.
Scenario
| Timeframe | Weekly |
| Recommendation | SELL STOP |
| Entry point | 2812.45 |
| Take Profit | 2500.00, 2187.50 |
| Stop Loss | 3010.00 |
| Key levels | 2187.50, 2500.00, 2812.50, 3125.00, 3560.00, 3750.00 |
Alternative scenario
| Recommendation | BUY STOP |
| Entry point | 3125.05 |
| Take Profit | 3560.00, 3750.00 |
| Stop Loss | 2880.00 |
| Key levels | 2187.50, 2500.00, 2812.50, 3125.00, 3560.00, 3750.00 |
