

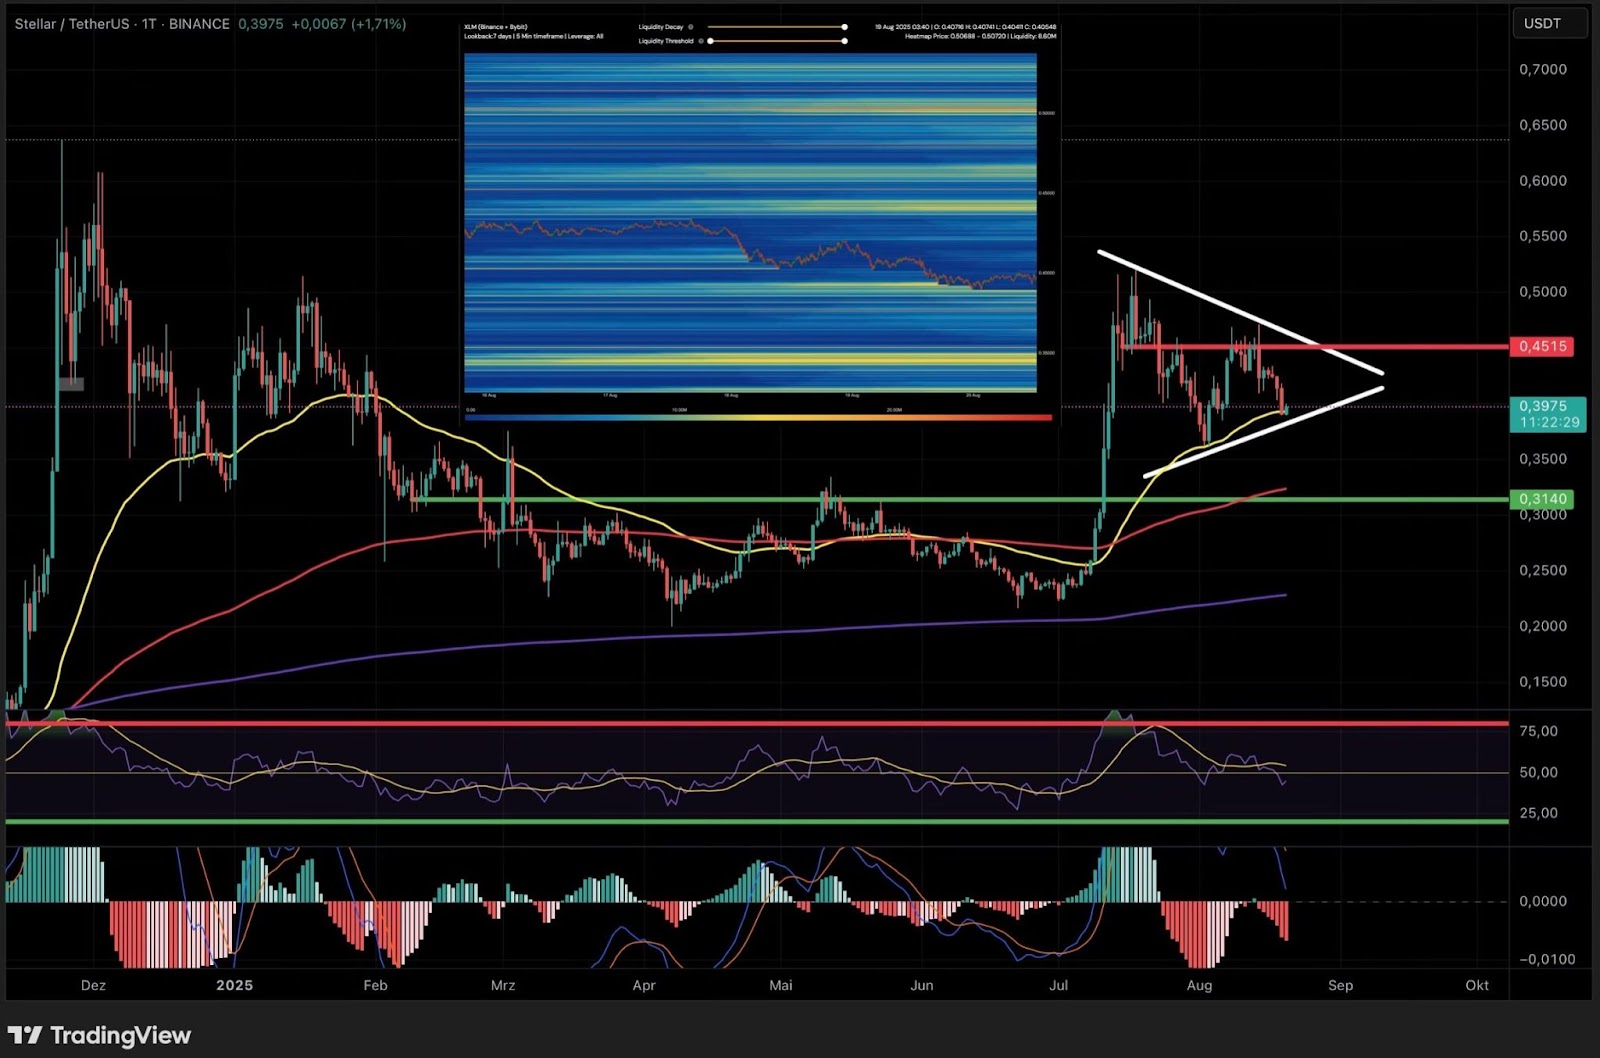
If Bitcoin extends its decline, XLM will likely struggle as well. In that case, the spotlight shifts to the next major liquidity zone around $0.35, which also coincides with the 200-day EMA. This confluence makes the area a strong candidate for support. Indicators, however, remain weak. The Relative Strength Index (RSI) has slipped below 50, highlighting fading momentum, while the MACD continues to build negative pressure with no sign of reversal yet. For now, XLM is stuck in a tense setup: holding the 50-day EMA keeps the door open for a bullish breakout, but losing it would strengthen the bearish case and draw attention to $0.35.
Tense Setup on the 4-Hour Chart with Early Relief Signals
On the 4-hour timeframe, the situation looks fragile. By breaking below both the 50 EMA and the 200 EMA, XLM has lost two key supports, which are now likely to act as resistance if retested. A rejection at these levels would confirm the bearish structure and increase the risk of another sell-off.
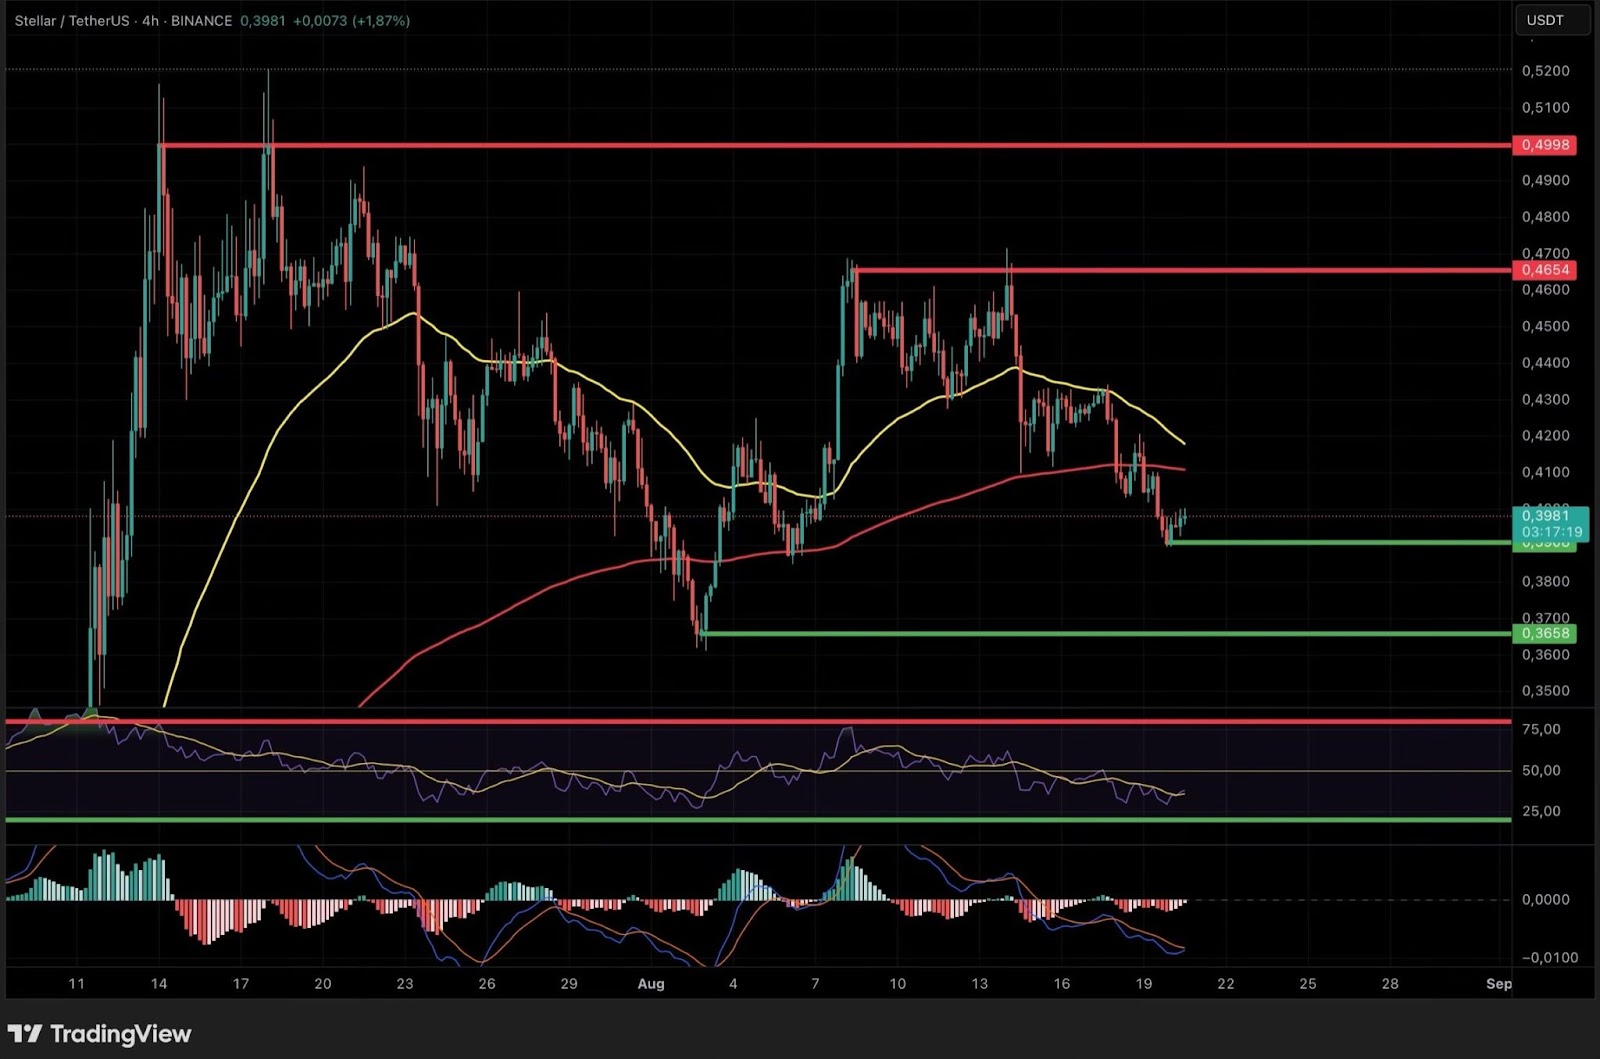
XLM 4-hour chart with indicators | Source: TradingView
However, some relief signals are emerging. The RSI is currently in oversold territory, suggesting potential for a short-term rebound. The MACD also shows weakening negative momentum, hinting at a possible technical bounce. Together, these factors support the idea of a corrective move higher in the near term.
For such a rebound to gain traction, XLM must reclaim the 50 EMA and 200 EMA and establish them as support again. Failure to do so would reinforce the bearish trend and maintain downside pressure.