

Overall, the cryptocurrency market remains influenced by a combination of opposing factors. On the supportive side, risk appetite strengthened following the release of the US Consumer Price Index for November, which slowed to 2.7% year-on-year. Together with a rise in the unemployment rate to 4.6%, this shifts the balance of economic risks toward a cooling labor market, reinforcing expectations of a further meaningful rate cut and increasing pressure on the US dollar. In addition, at its final meeting of the year, the Bank of Japan raised borrowing costs to 0.75% but emphasized that, given current inflation dynamics, real rates remain effectively negative. This allows investors to continue using the yen for carry trades, involving low-cost borrowing in Japanese currency to invest in higher-yielding and risk-sensitive assets, including digital assets.
At the same time, upside momentum remains capped by trader caution typical of the year-end period, as market participants prefer to refrain from major positioning decisions. It is also worth noting that overall sentiment in the digital asset market remains negative, as reflected by a reduction in Bitcoin ETF holdings, which declined by 497.1 million dollars last week. The Crypto Fear & Greed Index edged slightly higher over the weekend but continues to remain in the “extreme fear” zone at a reading of 25.
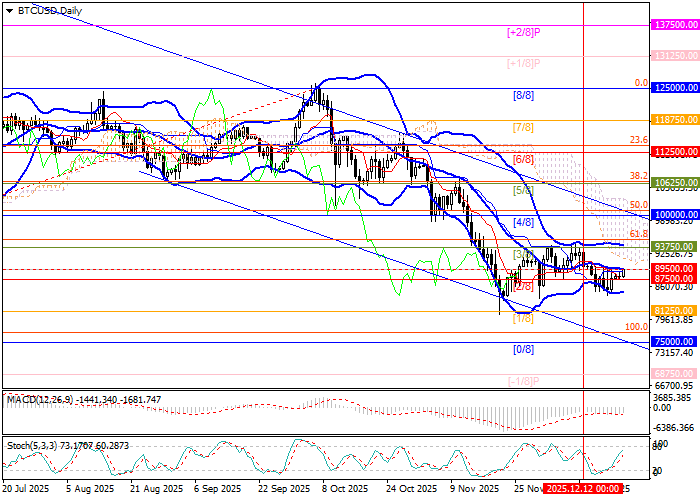
Support and Resistance Levels
The instrument is consolidating within the 87,500.00–89,500.00 range, bounded by the Murray level [2/8] and the middle line of the Bollinger Bands, forming a descending channel. A downside breakout below 84,365.00 (last week’s low) could open the way for a decline toward 75,000.00 (Murray level [0/8]) and 68,750.00 (Murray level [–1/8]). Conversely, a breakout above the upper Bollinger Band at 93,750.00 (Murray level [3/8]) would signal an upside exit from the range, with further gains toward 100,000.00 (Murray level [4/8]) and 106,250.00 (Murray level [5/8]).
Technical indicators do not provide a clear directional signal: the Bollinger Bands are moving sideways, the MACD histogram remains stable in negative territory, while the Stochastic oscillator is approaching the overbought zone and may turn lower, suggesting the potential for corrective downside movement.
Resistance levels: 93,750.00, 100,000.00, 106,250.00.
Support levels: 84,365.00, 75,000.00, 68,750.00.
Trading Scenarios and BTC/USD Forecast
Short positions can be opened below the 84,365.00 level with targets at 75,000.00 and 68,750.00, and a stop-loss at 90,600.00. Time horizon: 5–7 days.
Long positions can be opened above the 93,750.00 level with targets at 100,000.00 and 106,250.00, and a stop-loss at 88,600.00.
Scenario
| Timeframe | Weekly |
| Recommendation | SELL STOP |
| Entry point | 84,300.00 |
| Take Profit | 75,000.00, 68,750.00 |
| Stop Loss | 90,600.00 |
| Key levels | 68,750.00, 75,000.00, 84,365.00, 93,750.00, 100,000.00, 106,250.00 |
Alternative Scenario
| Recommendation | BUY STOP |
| Entry point | 93,800.00 |
| Take Profit | 100,000.00, 106,250.00 |
| Stop Loss | 88,600.00 |
| Key levels | 68,750.00, 75,000.00, 84,365.00, 93,750.00, 100,000.00, 106,250.00 |
