

Additional support came from the housing market. According to the Mortgage Bankers Association (MBA), the average rate on 30-year mortgages for loans up to $806.5K fell to 6.09% from 6.17%, prompting a 0.4% increase in mortgage applications after a 2.8% rise the previous week. The resilience of both the labor market and housing sector allows the Federal Reserve to maintain a pause in monetary policy adjustments at its March 18 meeting. CME FedWatch data show a roughly 96.0% probability that rates will remain in the 3.50–3.75% range.
Market participants currently expect any policy shift to occur no earlier than mid-summer, after Jerome Powell steps down as Fed Chair, although he will retain nearly two years of his mandate as a member of the Board of Governors. Traditionally, outgoing chairs refrain from voting once a successor is confirmed, but should Powell choose to remain active, his participation could meaningfully influence the balance of power within the committee.
Equities are also drawing support from strong earnings in the technology sector. Nvidia Corp. reported quarterly revenue of $68.1 billion, well above $57.0 billion in the previous quarter and $39.33 billion a year earlier. Earnings per share came in at $1.62, compared with $1.30 and $0.89 previously. Meanwhile, cloud CRM leader Salesforce Inc. confirmed revenue of $11.2 billion, exceeding prior figures of $10.3 billion and $9.99 billion, while EPS reached $3.81 versus $3.25 and $2.78 earlier.
The bond market also reacted to the improving macro backdrop, with yields gradually adjusting lower at the long end. Twelve-month Treasuries now yield 3.523% versus 3.506% last Friday, while 10-year yields eased to 3.998% from 4.091%. Yields on 20- and 30-year bonds declined to 4.596% and 4.655%, respectively, from 4.669% and 4.725%.
Top gainers within the index include Caesars Entertainment (+19.11%), Paramount Skydance (+10.04%), GoDaddy (+8.95%), and J.M. Smucker (+8.82%).
Notable laggards include United Health Services (–11.44%), Corning (–6.31%), Enphase Energy (–5.61%), and Albemarle (–5.59%).
Support and resistance levels
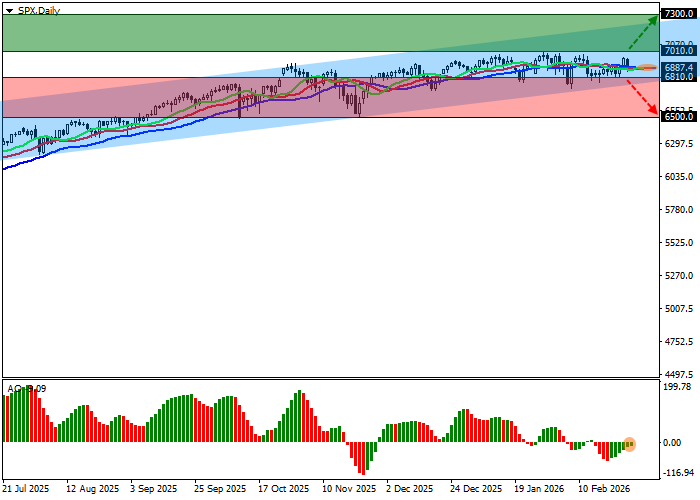
On the daily chart, the index is attempting to regain upside momentum while remaining within the broader ascending channel defined by the 7,300.0–6,800.0 range.
Technical indicators point to a weakening buy signal amid the current correction. Fast EMAs on the Alligator indicator are converging toward the signal line, while the Awesome Oscillator histogram is printing corrective bars in positive territory.
Resistance levels: 7,010.0, 7,300.0.
Support levels: 6,810.0, 6,500.0.
Trading scenarios and S&P 500 outlook
Long positions may be considered after a confirmed break and hold above 7,010.0, with a target at 7,300.0. Stop-loss: 6,900.0. Time horizon: 7 days or more.
Short positions may be considered after a confirmed break below 6,810.0, targeting 6,500.0. Stop-loss: 6,900.0.
