

Management announced an investment of more than $1.0 billion in a new cell therapy manufacturing facility in Montgomery County, Pennsylvania. The project is designed to strengthen supplies of specialized medicines in oncology, immunology, and neurology, create around 500 permanent pharmaceutical jobs, and more than 4,000 jobs during the construction phase. This initiative is part of a broader U.S. investment plan totaling $55.0 billion through 2029. Construction is scheduled to begin in the second half of 2026, with full production capacity expected by 2031. The new facility will enhance the company’s presence in advanced biotechnology and reduce logistical risks across its global supply chain. In addition, the corporation has submitted a supplemental application to the U.S. Food and Drug Administration (FDA) seeking approval of IMAAVY for the treatment of warm autoimmune hemolytic anemia, a rare and serious condition for which no FDA-approved therapies currently exist. Results from Phase II and III trials showed a sustained hemoglobin response, which could make the drug the first approved treatment for this disease and expand its use beyond its existing approved indication.
The company’s first-quarter financial report will be released on April 14. Analysts expect revenue to decline from $24.6 billion to $23.6 billion, still above the $21.89 billion recorded in the same period last year, while earnings per share (EPS) are forecast to increase from $2.46 to $2.69, compared with $2.77 a year earlier. The previous dividend payment took place on December 9 and amounted to $1.30 per share, equivalent to a quarterly yield of 2.52%, slightly above the sector average of 2.49%. The next dividend is scheduled for March 10, 2026, also at $1.30 per share, corresponding to a quarterly yield of 2.12%.
Support and Resistance Levels
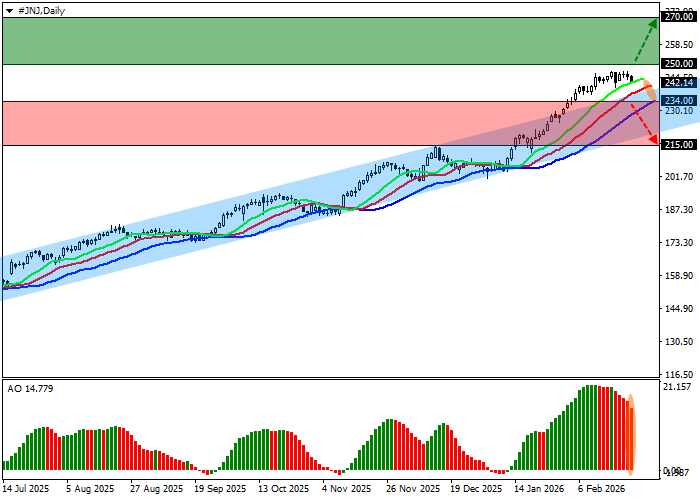
On the daily chart, the instrument is trading above the resistance line of an ascending channel with dynamic boundaries at 240.00–220.00.
Technical indicators are slightly moderating the buy signal: the fast EMAs of the Alligator indicator remain just above the signal line, while the AO histogram is forming corrective bars.
Resistance levels: 250.00, 270.00.
Support levels: 234.00, 215.00.
Trading Scenarios and Johnson & Johnson Stock Forecast
Long positions can be considered after a breakout and consolidation above 250.00, with a target at 270.00. Stop-loss — below the 240.00 support level. Time horizon: 7 days or more.
Short positions can be considered after a decline and consolidation below 234.00, with a target at 215.00 and a stop-loss at 242.00.
Scenario
| Timeframe | Weekly |
| Recommendation | BUY STOP |
| Entry Point | 250.05 |
| Take Profit | 270.00 |
| Stop Loss | 240.00 |
| Key Levels | 215.00, 234.00, 250.00, 270.00 |
Alternative Scenario
| Recommendation | SELL STOP |
| Entry Point | 233.95 |
| Take Profit | 215.00 |
| Stop Loss | 242.00 |
| Key Levels | 215.00, 234.00, 250.00, 270.00 |
