

This development has already been reflected in oil prices, which have shown heightened volatility since the market open. A key factor for further price dynamics will be how Latin American countries respond to the abduction of the presidential couple. Meanwhile, U.S. authorities intend to temporarily govern Venezuela “until a safe, proper, and lawful transfer of power is carried out” and to use the country’s vast oil reserves for sales to other nations. President Donald Trump stated this several hours after the military operation.
The sharp escalation in tensions creates additional barriers for importers, which were taken into account by OPEC+ representatives. Following Sunday’s meeting, the group decided to maintain crude oil production levels unchanged for February and March, despite internal disagreements between Saudi Arabia and the United Arab Emirates (UAE). Previously, the cartel emphasized its intention to act flexibly and its readiness to “partially or fully” reinstate production cuts of 1.65 million barrels per day, as well as the 2.2 million barrels per day already returned to the market.
As for U.S. energy inventory data, it will be released on the standard schedule this week. The American Petroleum Institute (API) may report further growth on Tuesday at 23:30 (GMT+2), following the previously recorded increase of 1.700 million barrels. Regarding the U.S. Energy Information Administration (EIA), after a decline of 1.934 million barrels last week, a shift in dynamics is possible. If the API report shows an increase for the third consecutive time, this is likely to be reflected in the EIA figures as well.
Investment demand is gradually recovering. During trading on January 2 at the Chicago Mercantile Exchange (CME), 478.0 thousand futures positions and 149.6 thousand options positions were recorded. This exceeds the average volumes seen in the final week of December, which stood at 400.0 thousand and 88.0 thousand, respectively.
Support and Resistance Levels
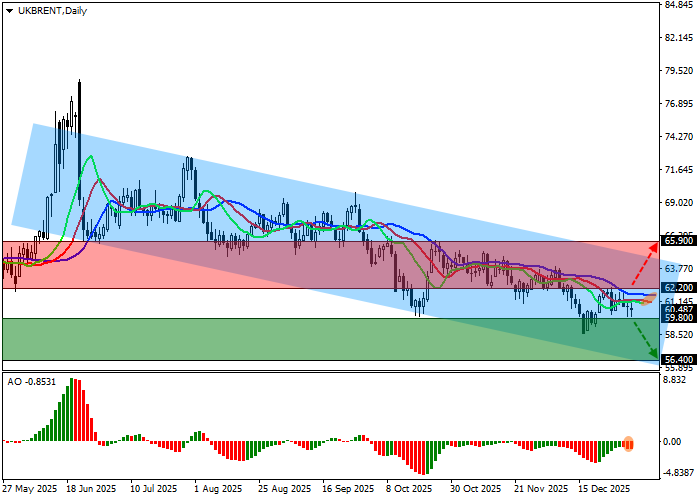
On the daily chart, the instrument is approaching the support line of the channel with dynamic boundaries at 64.00–55.50, moving within a new downward corrective wave.
Technical indicators maintain a sell signal, which is gradually strengthening. The fast EMAs of the Alligator indicator remain below the signal line and are now moving further away from it, while the AO histogram is forming new corrective bars in the sell zone.
Support levels: 59.80, 56.40.
Resistance levels: 62.20, 65.90.
Trading Scenarios and Brent Crude Oil Forecast
Short positions should be opened after the price consolidates below the 59.80 level, with a target at 56.40. Stop-loss: 61.00. Time horizon: 7 days or more.
Long positions should be opened after the price consolidates above the 62.20 level, with a target at 65.90. Stop-loss: 61.00.
Scenario
| Timeframe | Weekly |
| Recommendation | SELL STOP |
| Entry point | 59.80 |
| Take Profit | 56.40 |
| Stop Loss | 61.00 |
| Key levels | 56.40, 59.80, 62.20, 65.90 |
Alternative scenario
| Recommendation | BUY STOP |
| Entry point | 62.20 |
| Take Profit | 65.90 |
| Stop Loss | 61.00 |
| Key levels | 56.40, 59.80, 62.20, 65.90 |
