

This move was driven by fears of energy supply disruptions through the Strait of Hormuz, which remains blocked by Iran’s Islamic Revolutionary Guard Corps (IRGC), as well as strikes on Iranian oil infrastructure, including storage facilities. At the same time, the U.S. president said that such a rise in prices was “a very small price to pay” for eliminating the Islamic Republic’s “nuclear threat” and ensuring global security, effectively confirming that the Republican administration is willing to accept economic consequences in pursuit of military objectives. Nevertheless, he also stated that he already has a plan to deal with higher energy prices, although he did not disclose any details. It appears likely that the United States and other G7 members will soon try to ease price dynamics by releasing additional strategic reserves onto the market. However, without peace initiatives and steps to halt attacks on oil infrastructure, this would only be a temporary measure. Current plans reportedly involve releasing 300.0–400.0 million barrels of oil, equivalent to 25.0–30.0% of total reserves estimated at 1.2 billion barrels. Under International Energy Agency (IEA) rules, member countries must hold crude oil reserves equal to at least 90 days of imports. By the end of February, the U.S. Strategic Petroleum Reserve contained 415.0 million barrels — about 70.0% of the volume the country held before February 2022, when the Russian-Ukrainian crisis began.
Against this backdrop, the U.S. dollar is showing exceptional strength. The USDX has risen to three-month highs above 99.60, gaining more than 0.7% on safe-haven demand amid geopolitical tensions, as well as from the United States’ status as a net exporter of energy, which improves the terms of trade and attracts capital into dollar-denominated assets. Expectations for monetary policy have also shifted: investors believe the Federal Reserve may keep the interest rate within the 3.50–3.75% range, postponing any cuts amid a likely acceleration in inflation due to turmoil in energy markets. The most important release for markets will be tomorrow’s consumer price index data at 15:30 (GMT+2): on a monthly basis, the headline figure is expected to rise from 0.2% to 0.3%, while the annual rate may increase from 2.4% to 2.5%. Core CPI is projected to slow from 0.3% to 0.2% month-over-month and remain around 2.5% year-over-year. However, analysts warn that February inflation data may have only a limited impact on rate expectations, as it still does not reflect the full effect of the sharp jump in fuel prices.
The probability of tighter monetary policy from the Reserve Bank of Australia (RBA) is also increasing, as January consumer inflation remained at 3.8% instead of falling to the expected 3.7% in annual terms, staying above the target range of 2.0–3.0%. The trimmed mean stood at 3.4% versus 3.3% expected, while the weighted median rose from 3.2% to 3.6%. The escalation of geopolitical tensions in the Middle East further increases the risk of worsening inflationary pressures. Australia’s macroeconomic data published today was mixed: the March consumer confidence index from the University of Melbourne rose by 1.2% after falling by –2.6% previously, while the National Australia Bank business confidence index dropped from 4.0 points to –1.0 point in February, coming in below average analyst forecasts. Meanwhile, the business conditions indicator held at 7.0 points, exerting local pressure on the national currency.
Support and resistance levels
On the daily chart, Bollinger Bands are flattening into a horizontal pattern: the price range is narrowing, reflecting mixed trading dynamics in the ultra-short term. MACD is attempting to turn higher, forming a new buy signal as the histogram moves toward crossing above the signal line. Stochastic is also turning upward around the middle of its range, favoring the continuation of upward momentum over the next several trading intervals.
Resistance levels: 0.7100, 0.7150, 0.7202, 0.7250.
Support levels: 0.7050, 0.7000, 0.6950, 0.6900.
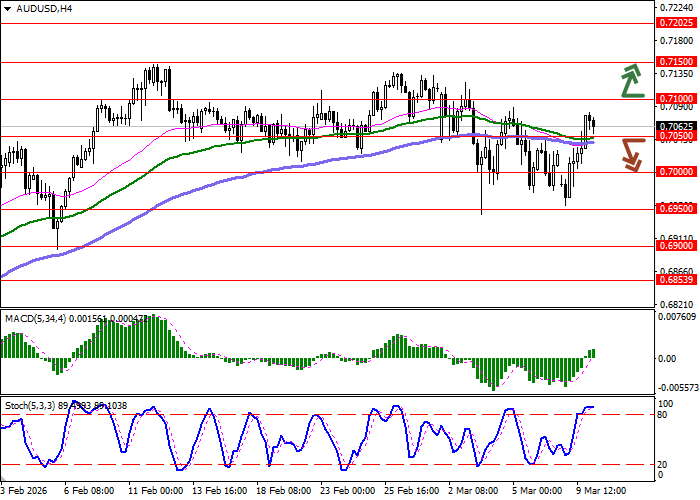
Trading scenarios and AUD/USD forecast
Long positions may be considered after a confident breakout above 0.7100 with a target at 0.7202. Stop-loss — 0.7050. Timeframe: 2–3 days.
A return of bearish momentum followed by a breakout below 0.7050 may become a signal to open short positions with a target at 0.6950. Stop-loss — 0.7100.
Scenario
| Timeframe | Intraday |
| Recommendation | BUY STOP |
| Entry Point | 0.7105 |
| Take Profit | 0.7202 |
| Stop Loss | 0.7050 |
| Key Levels | 0.6900, 0.6950, 0.7000, 0.7050, 0.7100, 0.7150, 0.7202, 0.7250 |
Alternative Scenario
| Recommendation | SELL STOP |
| Entry Point | 0.7045 |
| Take Profit | 0.6950 |
| Stop Loss | 0.7100 |
| Key Levels | 0.6900, 0.6950, 0.7000, 0.7050, 0.7100, 0.7150, 0.7202, 0.7250 |
