

Against the backdrop of escalating tensions in the Middle East, global energy markets are experiencing one of their most volatile periods in recent years. Brent Crude Oil prices recently climbed to $119.0–$120.0 per barrel, the highest levels since 2022. The rally reflects market reactions to supply disruptions through the Strait of Hormuz — a critical route responsible for roughly 20.0% of global crude oil exports.
At the same time, European natural gas prices, measured by TTF futures, surged by 30.0% to €69.5 per megawatt-hour, equivalent to approximately $840.0–$850.0 per 1,000 cubic meters. This continues the negative trend observed last week, partly driven by partial or full production shutdowns following supply interruptions from QatarEnergy.
In response to these challenges, G7 countries have intensified coordination and joint monitoring of risks. EU member states confirmed that they currently hold strategic oil reserves equivalent to around 90 days of consumption and do not yet see an immediate risk of supply shortages, although rising prices and market instability remain a concern.
The International Energy Agency (IEA), which coordinates emergency reserves among major importers, is also considering releasing part of these reserves — estimated at 300.0–400.0 million barrels — to stabilize the market. Upcoming meetings between EU and G7 representatives will focus on coordinating response measures in case the situation deteriorates further and strengthening energy supply resilience amid growing geopolitical uncertainty.
Meanwhile, France held auctions for short-term government bonds. Three-month and six-month securities were placed at yields of 2.097% and 2.217%, respectively, significantly higher than last week’s 2.030% and 2.065%. One-year bonds were sold at 2.339% compared with 2.097% previously.
After reaching an interim high of 2.330%, longer-term bonds are now consolidating. One-year bonds are trading with yields around 2.369%, slightly above Friday’s 2.275%, while 10-year bonds stand at 3.507% compared with 3.481%. Yields on 20-year and 30-year securities are at 4.073% and 4.388%, respectively, up from 4.038% and 4.373% at the end of last week.
The top gainers in the index include Thales SA (+2.57%), STMicroelectronics NV (+1.99%), TotalEnergies SE (+1.31%), Airbus Group SE (+0.05%), and Hermès International SCA (+0.02%).
Among the biggest decliners are ArcelorMittal SA (–3.88%), Unibail-Rodamco-Westfield SE (–3.46%), Dassault Systèmes SE (–3.42%), Stellantis NV (–3.16%), and Compagnie Générale des Établissements Michelin SCA (–3.03%).
Support and resistance levels
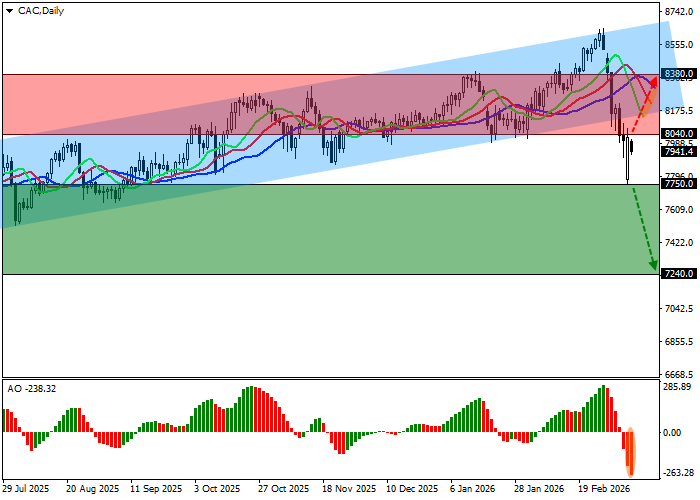
On the daily chart, the index continues a local correction but remains below the support line of the global ascending channel with dynamic boundaries at 8600.0–8150.0.
Technical indicators maintain a local sell signal that formed earlier this month: the fast EMAs on the Alligator indicator are widening their fluctuation range, while the AO histogram is forming corrective bars below the zero line.
Support levels: 7750.0, 7240.0.
Resistance levels: 8040.0, 8380.0.
Trading scenarios and CAC 40 forecast
Short positions may be considered after the price consolidates below 7750.0 with a target at 7240.0. Stop-loss — 7900.0. Timeframe: 7 days or more.
Long positions may be considered after the price consolidates above 8040.0 with a target at 8380.0 and a stop-loss at 7900.0.
Scenario
| Timeframe | Weekly |
| Recommendation | SELL STOP |
| Entry Point | 7749.5 |
| Take Profit | 7240.0 |
| Stop Loss | 7900.0 |
| Key Levels | 7240.0, 7750.0, 8040.0, 8380.0 |
Alternative Scenario
| Recommendation | BUY STOP |
| Entry Point | 8040.5 |
| Take Profit | 8380.0 |
| Stop Loss | 7900.0 |
| Key Levels | 7240.0, 7750.0, 8040.0, 8380.0 |
