
The number of jobs declined by 92.0K compared with the consensus forecast of 58.0K, sharply contrasting with January’s 126.0K (revised downward from 130.0K). Meanwhile, the unemployment rate rose from 4.3% to 4.4%. The healthcare sector, traditionally one of the key drivers of job creation, lost about 19.0K jobs, largely due to protest actions by medical workers demanding changes in staffing policies, higher wages, and improved working conditions. Against this backdrop, about 31.0K specialists temporarily suspended work.
At the same time, wage growth continues according to plan: average hourly earnings increased by 3.8% year-over-year. Initial jobless claims remained at 213.0K, below the preliminary estimate of 215.0K. The four-week average declined from 220.50K to 215.75K, while continuing claims rose from 1.822M to 1.868M. Overall, the weak labor market data could signal a potential shift by the U.S. Federal Reserve back toward a dovish stance and possible rate cuts from the current 3.50–3.75% range, although the CME FedWatch Tool currently indicates a 95.4% probability that rates will remain unchanged.
Against this backdrop, comments from monetary authorities have become particularly important for investors. Minneapolis Federal Reserve Bank President Neel Kashkari stated that the conflict between the United States and Iran has increased uncertainty regarding the regulator’s next steps. While he had previously expected at least one rate cut this year, he now believes it is necessary to adopt a wait-and-see approach to assess the economic impact of the conflict. His colleague from the New York Fed, John Williams, suggested that monetary easing could occur if the consumer price index continues to steadily decline toward 2.0%. He also projected 2.5% GDP growth this year, supported by fiscal stimulus measures, favorable financial conditions, and strong investment in artificial intelligence.
Meanwhile, the euro remains under pressure from the further escalation of tensions in the Middle East. The blockade of the Strait of Hormuz by Iran’s Islamic Revolutionary Guard Corps — through which about 20% of global oil supplies pass — together with ongoing strikes on regional energy infrastructure has driven Brent crude oil prices above $82 per barrel, which could worsen trade conditions. Liquefied natural gas production in Qatar, one of the world’s largest exporters, was also suspended after attacks on gas facilities, pushing European gas prices up by 38–45%, and on some trading platforms even more than 50% compared with reports published before February 28.
Macroeconomic data also fails to support the euro. Retail sales in January declined by 0.1% month-over-month against a forecast of 0.3%, although the annual figure exceeded expectations at 2.0%. Gross domestic product for the fourth quarter grew by just 0.2% quarter-over-quarter and 1.2% year-over-year, signaling slow economic recovery amid persistent external risks. Market expectations for the ECB’s next steps remain largely unchanged, with more than 96% probability that policy settings will remain unchanged at the March meeting.
Nevertheless, the “inflation shock” from rising energy prices is gradually being priced in, and markets are discussing potential adjustments to monetary policy. While such changes are typically positive for a currency, in the current environment they are not sufficient to offset geopolitical pressure. Last week, ECB Vice President Luis de Guindos, Bundesbank President Joachim Nagel, and Bank of Finland Governor Olli Rehn warned that a prolonged Middle East conflict could significantly slow economic activity. Bank of Spain Governor José Luis Escrivá also noted that policymakers are unlikely to adjust interest rates at the upcoming meeting but expressed hope that the economic damage from the crisis will remain limited.
Support and resistance levels
On the daily chart, Bollinger Bands indicate a strong downward trend, with the price range expanding to the downside and opening the way for bears to push toward new lows. The MACD continues to decline, maintaining a strong sell signal (the histogram remains below the signal line). Meanwhile, the Stochastic oscillator is testing the 20 level for a downward breakout, signaling significant risks of short-term oversold conditions for the euro.
Resistance levels: 1.1529, 1.1577, 1.1600, 1.1621.
Support levels: 1.1500, 1.1450, 1.1400, 1.1367.
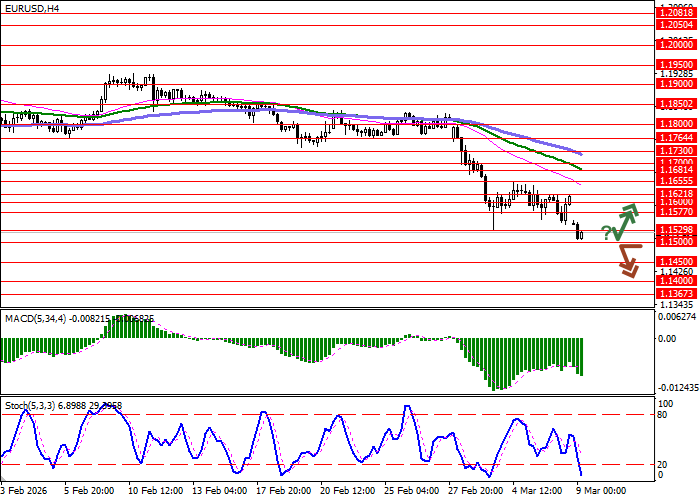
Trading scenarios and EUR/USD forecast
Short positions can be opened after a confident breakdown below 1.1500 with a target at 1.1367. Stop-loss — 1.1577. Implementation period: 1–2 days.
A rebound from the 1.1500 support level followed by a breakout above 1.1577 may signal an opportunity to open long positions with a target at 1.1700. Stop-loss — 1.1500.
