

The positive momentum of the U.S. dollar is slowing, with the USDX holding near 98.60 amid the ongoing government shutdown, which has halted the publication of key macroeconomic data. For instance, the September U.S. labor report has not been released. Meanwhile, analysts have sharply increased their expectations of a rate cut during the October FOMC meeting — according to the CME FedWatch Tool, the probability now exceeds 95%. At the same time, President Donald Trump once again drew global attention by announcing plans to raise tariffs on Chinese imports to 100% in response to Beijing’s tightening control over rare earth exports. Still, most experts believe these statements are mainly political pressure rather than a signal of a renewed trade war, as escalation would hurt both sides.
Support and Resistance Levels
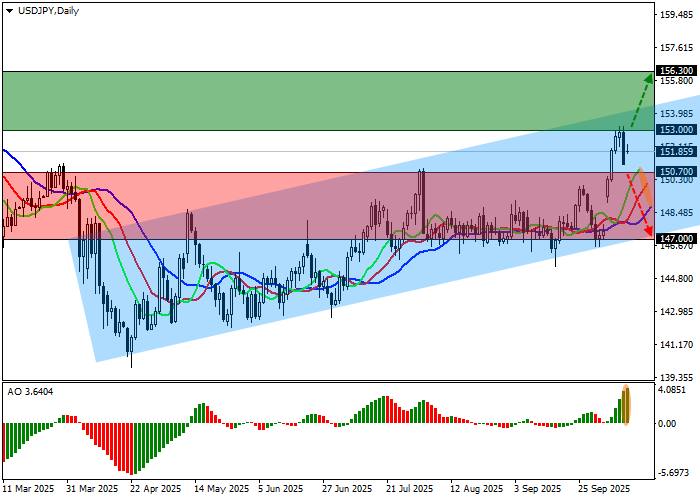
On the daily chart, USD/JPY is moving within an upward channel, approaching the upper resistance line between 154.00 and 147.00.
Technical indicators maintain a buy signal: fast EMAs on the Alligator indicator remain above the signal line, while the Awesome Oscillator (AO) histogram forms rising green bars in positive territory.
Resistance levels: 153.00, 156.30.
Support levels: 150.70, 147.00.
USD/JPY Trading Scenarios and Outlook
Long positions can be considered after the price consolidates above 153.00, with a target at 156.30 and a stop loss at 152.00. Estimated duration: 7 days or more.
Short positions can be opened after a breakout and consolidation below 150.70, targeting 147.00 with a stop loss at 152.00.
Scenario
| Timeframe | Weekly |
| Recommendation | BUY STOP |
| Entry Point | 153.05 |
| Take Profit | 156.30 |
| Stop Loss | 152.00 |
| Key Levels | 147.00, 150.70, 153.00, 156.30 |
Alternative Scenario
| Recommendation | SELL STOP |
| Entry Point | 150.65 |
| Take Profit | 147.00 |
| Stop Loss | 152.00 |
| Key Levels | 147.00, 150.70, 153.00, 156.30 |
