

According to media reports, company founder Jack Ma may return, which would signal a weakening of the Chinese government’s antitrust pressure that has persisted since 2020. In addition, it was revealed that contracts have been signed between the under-construction Sanjiangyuan data center and AI chip suppliers, including Alibaba’s subsidiary T-Head.
The financial report will be released on November 13: preliminary estimates suggest revenue of 245.42 billion yuan, lower than the previous 247.7 billion but higher than last year’s 236.5 billion, with earnings per share expected at 8.74 yuan compared to 14.75 yuan and 15.06 yuan in prior years. The company also issued a special dividend of 1.98 yuan per share on July 10, yielding 1.65% versus the sector median of 0.65%.
Support and Resistance Levels
On the daily chart, the instrument is moving away from the upper boundary of a recent “triangle” pattern with dynamic limits of 126.00–105.00.
Technical indicators are strengthening the buy signal: the EMA range on the Alligator indicator is widening, while the AO histogram forms rising bars in the positive zone.
Resistance levels: 166.00, 183.00.
Support levels: 154.70, 131.00.
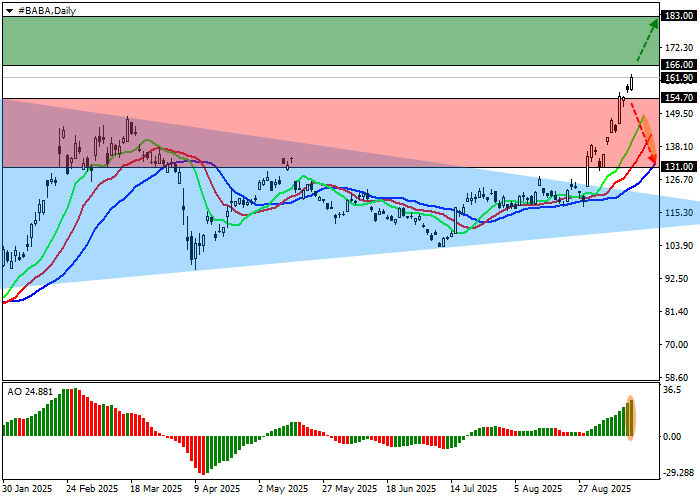
Trading Scenarios and Alibaba Stock Forecast
Long positions can be opened after a breakout and consolidation above 166.00 with a target at 183.00. Stop-loss — above 158.00. Implementation period: 7 days or more.
Short positions can be opened after a decline and consolidation below 154.70 with a target at 131.00 and a stop-loss at 165.00.
Scenario
| Timeframe | Weekly |
| Recommendation | BUY STOP |
| Entry Point | 166.05 |
| Take Profit | 183.00 |
| Stop Loss | 158.00 |
| Key Levels | 131.00, 154.70, 166.00, 183.00 |
Alternative Scenario
| Recommendation | SELL STOP |
| Entry Point | 154.65 |
| Take Profit | 131.00 |
| Stop Loss | 165.00 |
| Key Levels | 131.00, 154.70, 166.00, 183.00 |
