

Yesterday, the U.S. Federal Aviation Administration (FAA) issued a ruling in a long-running case regarding multiple safety violations, imposing a fine of $3.1 million. However, Democratic Senator Richard Blumenthal, who investigated many of the incidents, expressed doubts that such a small penalty would change Boeing management’s approach to product reliability. For comparison, the company recently secured a $198.0 million contract from the U.S. Air Force to extend the service life of F/A–18 Block II Super Hornet aircraft.
Analysts expect Q3 earnings to show revenue of around $21.49 billion, down from $22.75 billion in the previous quarter but well above $17.80 billion a year earlier. Loss per share is also projected to narrow to –$0.434 compared to –$1.240 and –$10.440 in prior reporting periods.
Support and Resistance Levels
On the daily chart, the instrument is moving below the support line of an ascending channel with dynamic boundaries at 260.00–225.00.
Technical indicators maintain a bearish bias: EMA fluctuations on the Alligator indicator remain wide, while the AO histogram continues to print correctional bars in the negative zone.
Resistance levels: 223.00, 238.00.
Support levels: 209.00, 188.00.
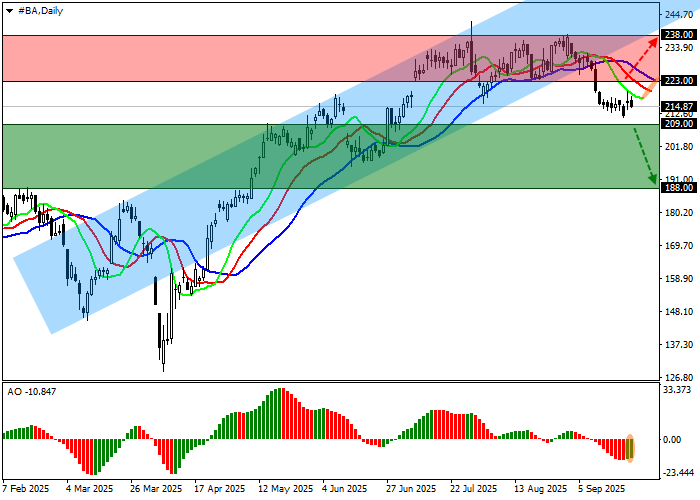
Trading Scenarios and Boeing Stock Forecast
Short positions may be opened after a decline and close below 209.00, targeting 188.00. Stop-loss at 218.00. Timeframe: 7 days or more.
Long positions may be considered after a breakout above 223.00, with targets at 238.00 and stop-loss at 210.00.
Scenario
| Timeframe | Weekly |
| Recommendation | SELL STOP |
| Entry Point | 208.95 |
| Take Profit | 188.00 |
| Stop Loss | 218.00 |
| Key Levels | 188.00, 209.00, 223.00, 238.00 |
Alternative Scenario
| Recommendation | BUY STOP |
| Entry Point | 223.05 |
| Take Profit | 238.00 |
| Stop Loss | 210.00 |
| Key Levels | 188.00, 209.00, 223.00, 238.00 |
