

The corporation continues its business restructuring, and as part of the corporate transition, Neil Hansen will replace Kathryn Mikells as Chief Financial Officer in February 2026. In addition, according to management, in February 2026, amid a lack of candidates, the planned acquisition of an ethylene plant in Scotland will be canceled, which will result in the loss of about 200 jobs. Meanwhile, versus 2024 figures, ExxonMobil Corp. expects an increase of $25.0 billion in profit and $35.0 billion in cash flow, prompting Morgan Stanley to raise its price target from $135.0 to $137.0 while maintaining an “overweight” rating.
The Q4 financial report will be released on January 30: revenue is expected at $81.34 billion, below $85.29 billion in the prior quarter and $83.43 billion a year ago, with EPS of $1.66 versus $1.88 and $1.67, respectively. Yesterday, investors received the first dividend of the year, stepped up to $1.03 per share (3.47%); the date of the second payment has not yet been set. Assuming the customary annual increase, the yield may be around 3.50%, below the sector average of 5.12%.
Support and resistance levels
On the daily chart, the price is attempting to break the resistance line of the ascending channel with dynamic boundaries at 125.00–113.00.
Technical indicators are strengthening the buy signal: the Awesome Oscillator (AO) histogram is forming corrective bars, and the fast EMAs of the Alligator indicator remain above the signal line.
Resistance levels: 121.00, 126.00.
Support levels: 117.00, 110.00.
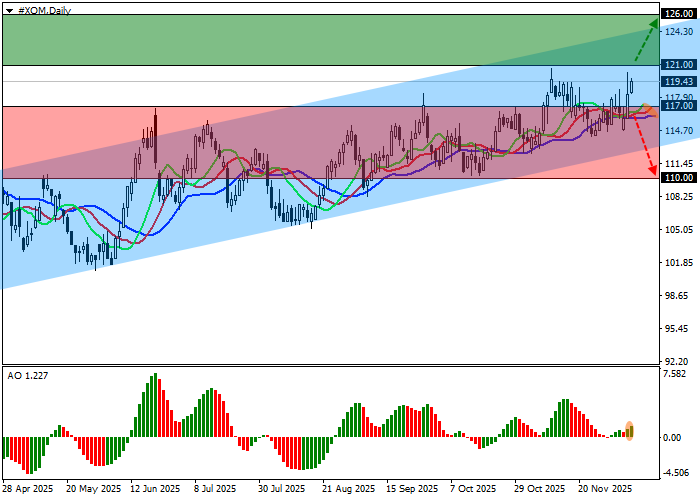
ExxonMobil: Trading Scenarios and Outlook
Long positions can be considered after a rise and consolidation above 121.00 with a target at 126.00. Stop-loss — 119.00. Implementation horizon: 7 days or more.
Short positions can be considered after a decline and consolidation below 117.00 with a target at 110.00 and a stop-loss at 119.00.
Scenario
| Timeframe | Weekly |
| Recommendation | BUY STOP |
| Entry point | 121.05 |
| Take Profit | 126.00 |
| Stop Loss | 119.00 |
| Key levels | 110.00, 117.00, 121.00, 126.00 |
Alternative scenario
| Recommendation | SELL STOP |
| Entry point | 116.95 |
| Take Profit | 110.00 |
| Stop Loss | 119.00 |
| Key levels | 110.00, 117.00, 121.00, 126.00 |
