

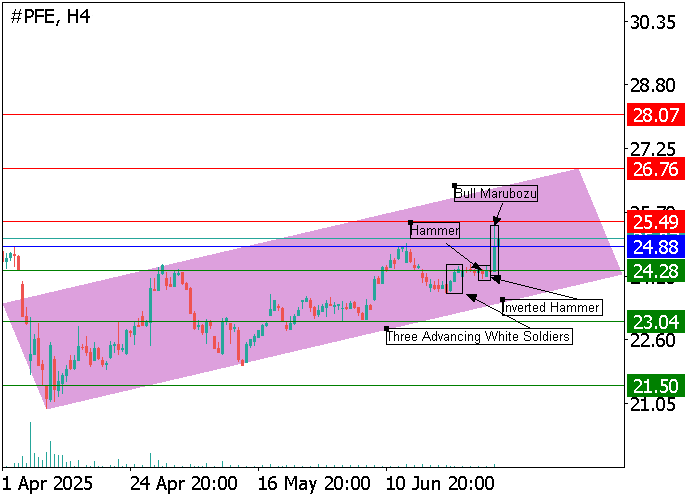
On the four-hour chart, Pfizer Inc. (PFE) is consolidating near $25.05. Notably, a cluster of bullish candlestick formations—including "Three White Soldiers," "Hammer," and "Inverted Hammer"—has emerged around the pivotal support at $24.28. These, combined with a prominent "Bullish Marubozu" between $24.28 and $24.88, reinforce the potential for an ongoing upward trend. Should buyers breach resistance at $25.49, further upside toward $26.76–$28.07 becomes likely. Conversely, a breakdown below $24.28 would indicate renewed bearish momentum, targeting $23.04 and potentially $21.50.
D1 Chart: Daily Bullish Momentum Builds
On the daily timeframe, bullish sentiment prevails, as patterns such as "Three White Soldiers," "Bullish Engulfing," and "Bullish Marubozu" are evident between $23.04 and $24.88. This signals strong continuation potential toward resistance at $25.49. A confirmed breakout above this level could accelerate gains toward $26.76–$28.07.
Key Support and Resistance Levels
- Support: $24.28, $23.04, $21.50
- Resistance: $25.49, $26.76, $28.07
Trading Strategies
- Bullish Setup: Initiate long positions above $25.49, targeting $26.76 and $28.07. Place a stop-loss at $24.88. (Timeframe: 7+ days)
- Bearish Setup (Alternative): Short entries may be considered below $24.28, with targets at $23.04 and $21.50; stop-loss at $24.88.
| Scenario | Timeframe | Recommendation | Entry Point | Take Profit | Stop Loss | Key Levels |
|---|---|---|---|---|---|---|
| Bullish | Weekly | BUY STOP | $25.50 | $26.76, $28.07 | $24.88 | $21.50, $23.04, $24.28, $25.49, $26.76, $28.07 |
| Bearish (Alt.) | Weekly | SELL STOP | $24.25 | $23.04, $21.50 | $24.88 | $21.50, $23.04, $24.28, $25.49, $26.76, $28.07 |
