

Today, Nvidia Corp. is set to release its financial results. The company is expected to report revenue of $45.81 billion after $44.06 billion in the previous quarter and $30.00 billion in the same period last year, while earnings per share may reach $1.00 compared to $0.76 and $0.68, respectively.
The bond market maintains a neutral stance. The 10-year yield eased from 4.325% earlier in the week to 4.271%, the 20-year yield declined from 4.912% to 4.887%, and the 30-year yield slipped from 4.934% to 4.926%.
Top gainers in the index include Eli Lilly and Company (+5.85%), GE Vernova LLC (+3.92%), The Boeing Co. (+3.51%), and GE Aerospace (+2.75%).
Top losers include Keurig Dr Pepper Inc. (–6.91%), eBay Inc. (–3.97%), and Brown-Forman Corp. (–3.83%).
Support and Resistance Levels
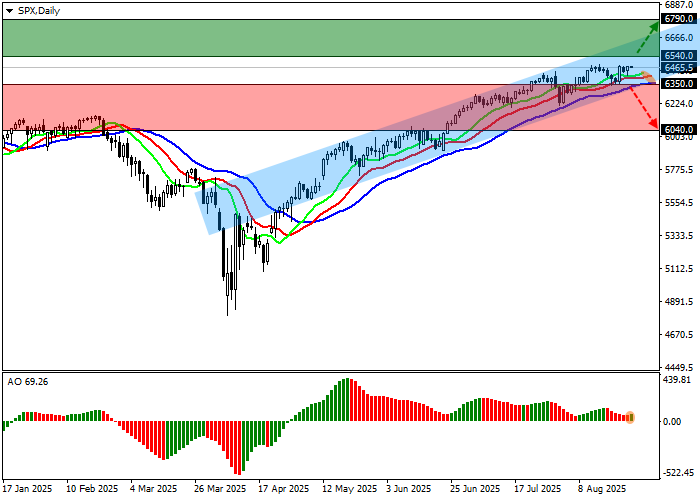
On the daily chart, the index remains in an upward trend, testing a new attempt to break the yearly high of 6460.0.
Technical indicators show a stable buy signal, though slightly weakened by the local correction: the fast EMAs on the Alligator indicator remain above the signal line, while the AO histogram forms corrective bars in the buying zone.
- Support levels: 6350.0, 6040.0
- Resistance levels: 6540.0, 6790.0
Trading Scenarios
If growth continues and the price consolidates above the resistance level of 6540.0, buy positions with a target of 6790.0 will be relevant. Stop-loss — 6450.0. Timeframe: 7 days or more.
If the decline continues and the price consolidates below the support level of 6350.0, sell positions with a target of 6040.0 will be relevant. Stop-loss — 6450.0.
Scenario
- Timeframe: Weekly
- Recommendation: BUY STOP
- Entry Point: 6540.0
- Take Profit: 6790.0
- Stop Loss: 6450.0
- Key Levels: 6040.0, 6350.0, 6540.0, 6790.0
Alternative Scenario
- Recommendation: SELL STOP
- Entry Point: 6350.0
- Take Profit: 6040.0
- Stop Loss: 6450.0
- Key Levels: 6040.0, 6350.0, 6540.0, 6790.0
