

Al Hadath, citing its own sources, reported that the preliminary agreement between Iran and the United States will be named the "Islamabad Declaration" and will be signed in the near term without a face-to-face meeting between delegations, after which the parties will begin a new round of diplomatic consultations around June 5. According to Axios, during a 60-day ceasefire the Strait of Hormuz will be opened to shipping without additional levies, Iran will agree to demine its waters to allow safe vessel passage, and US forces will lift the blockade on Iranian ports and grant certain sanctions exemptions — including allowing the free trade of crude oil — which analysts believe will enable a partial recovery of the Iranian economy and the energy market more broadly. However, it remains unclear whether the agreement will lead to a durable peace that addresses President Donald Trump's nuclear demands. Trump himself previously confirmed that understanding with Iran is "largely achieved," yet key disagreements remain active: Iranian authorities will not compromise without the release of a portion of frozen assets at the first stage, citing prior negative experience with White House commitments.
Analysts estimate that a Hormuz blockade lasting until August raises the risk of an economic contraction comparable to the 2008 financial crisis. If the waterway is fully reopened in July, average crude demand would fall by 2.6 million barrels per day and the spot price of Brent could peak at $130.00 during the summer. If shipping disruptions continue into August, the supply deficit in the third quarter could grow to approximately 6.0 million barrels per day.
The API weekly inventory report will be released tomorrow at 16:30 (GMT+2) on its regular schedule. Following last week's significant draw of 9.100 million barrels, further declines are expected. The EIA data will follow on Wednesday at 22:30 (GMT+2), with forecasts pointing to an additional draw of 1.900 million barrels on top of the prior –7.863 million.
On the investment demand side, mid-month trading activity has stabilized, with volumes now near the average levels seen in late April. According to CME data, 748,000 futures contracts were traded last Friday — compared to 1.5 million in the first week of the month. Options activity has also declined, with just 142,000 contracts recorded on May 15, down from 350,000 on May 7.
Support and Resistance Levels
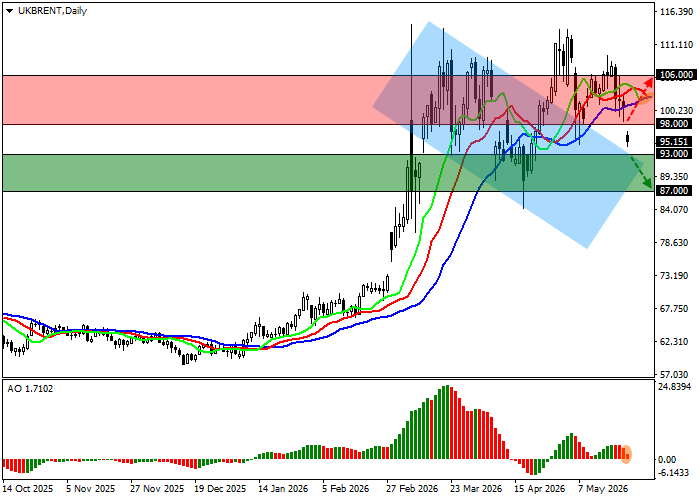
On the daily chart, price has returned to the area of recent lows — above the resistance line of a local descending channel bounded by $100.00 and $85.00 — and may extend the decline this week.
Technical indicators are maintaining a buy signal: the Alligator's fast EMAs remain above the signal line and are gradually converging toward it, while the Awesome Oscillator histogram is forming new corrective bars in positive territory.
Support levels: 93.00, 87.00.
Resistance levels: 98.00, 106.00.
Brent Crude Oil Trading Scenarios and Price Forecast
Short positions should be considered after the price consolidates below 93.00, targeting 87.00, with a stop-loss at 96.00. Time horizon: 7 days or more. Long positions should be considered after the price consolidates above 98.00, targeting 106.00, with a stop-loss at 94.00.
| Scenario | |
|---|---|
| Timeframe | Weekly |
| Recommendation | SELL STOP |
| Entry Point | 92.95 |
| Take Profit | 87.00 |
| Stop Loss | 96.00 |
| Key Levels | 87.00, 93.00, 98.00, 106.00 |
| Alternative Scenario | |
|---|---|
| Recommendation | BUY STOP |
| Entry Point | 98.05 |
| Take Profit | 106.00 |
| Stop Loss | 94.00 |
| Key Levels | 87.00, 93.00, 98.00, 106.00 |
