

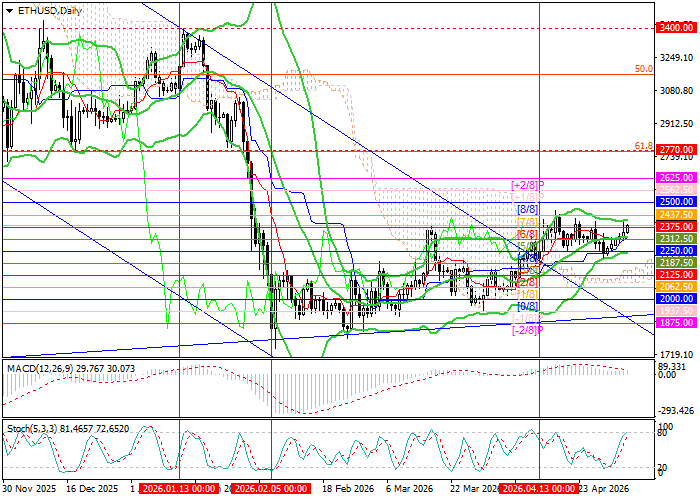
Technical indicators are not sending a unified signal: Bollinger Bands are moving horizontally, the MACD histogram is stable in positive territory, while the Stochastic has reached overbought levels and may reverse soon. It is also worth noting that on the weekly chart, Bollinger Bands are pointing downward, confirming that the long-term downtrend remains intact. Current price action suggests a flag pattern is forming — though a breakout above 2500.00 (Bollinger Bands midline, W1) could change the direction of the move.
Support and Resistance Levels
Resistance levels: 2500.00, 2812.50, 3125.00, 3400.00.
Support levels: 2250.00, 2000.00, 1875.00, 1481.60.
ETH/USD Trading Scenarios and Forecast
Long positions may be opened above 2500.00, targeting 2812.50, 3125.00, and 3400.00, with a stop-loss at 2315.00. Time horizon: 5–7 days.
Short positions should be opened below 2250.00, targeting 2000.00, 1875.00, and 1481.60, with a stop-loss at 2300.00.
Scenario
| Timeframe | Weekly |
| Recommendation | BUY STOP |
| Entry Point | 2510.00 |
| Take Profit | 2812.50, 3125.00, 3400.00 |
| Stop Loss | 2315.00 |
| Key Levels | 1481.60, 1875.00, 2000.00, 2250.00, 2500.00, 2812.50, 3125.00, 3400.00 |
Alternative Scenario
| Recommendation | SELL STOP |
| Entry Point | 2245.00 |
| Take Profit | 2000.00, 1875.00, 1481.60 |
| Stop Loss | 2300.00 |
| Key Levels | 1481.60, 1875.00, 2000.00, 2250.00, 2500.00, 2812.50, 3125.00, 3400.00 |
