
The key driver of price action remains geopolitical tensions in the Middle East, which are keeping oil prices above the $110.00 mark on exchanges, with delivery futures reaching the $150.00–$160.00 range — nearly three times higher than at the end of last year — fueling a rise in the consumer price index that already hit 3.0% last month. Yesterday, Bundesbank President Joachim Nagel stated that the European Central Bank (ECB) will tighten monetary policy in June if inflation forecasts do not improve in the near term. At last week's meeting, officials left the interest rate unchanged but signaled that if the US-Iran confrontation continues and hydrocarbon prices remain in line with the "adverse" scenario outlined at the end of March, one or even two rate adjustments may be required before autumn. According to Nagel, the regulator cannot contain rising fuel prices, but is in a position to counteract price increases in other categories of goods.
The US dollar, which is the primary driver of the pair, is trading at 98.10 on the USDX and may extend its local upside momentum as the probability of a near-term end to the Persian Gulf conflict has diminished following a recent resumption of hostilities. Although the intensity is significantly lower than in March, local media are reporting US Navy attempts to break the Strait of Hormuz blockade, as well as Iranian strikes on the energy infrastructure of the United Arab Emirates (UAE), including an oil terminal in the port city of Fujairah. According to Fox News, citing officials, the White House is prepared for an escalation: on Monday, CENTCOM commander Brad Cooper reported that under Project Freedom, naval forces destroyed six Iranian combat boats and intercepted a number of missiles and drones launched by the Islamic Revolutionary Guard Corps (IRGC), prompting retaliatory measures by the Islamic Republic against the UAE and Oman.
Meanwhile, US building permits in March fell from 1.538 million to 1.363 million, returning to February levels. Tomorrow at 14:30 (GMT+2), construction spending data for the same period will be released: analysts expect an increase from –0.3% to 0.4%, which could provide support for the US dollar.
Support and Resistance Levels
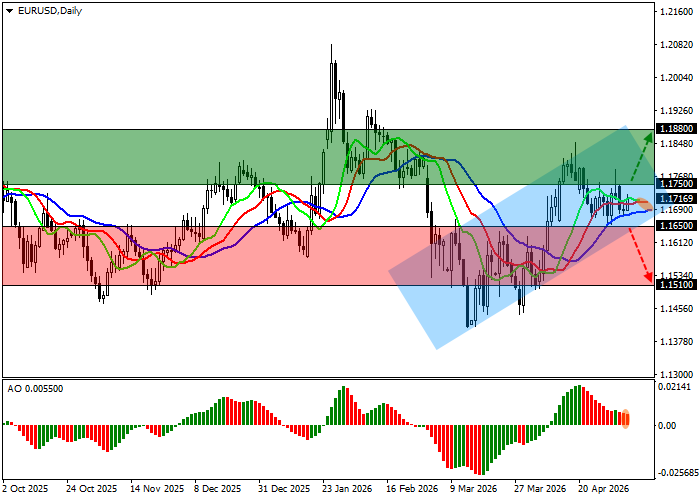
On the daily chart, the pair is pulling back from the support line of an ascending channel with boundaries at 1.1850–1.1660.
Technical indicators are weakening the buy signal generated in early April: the fast EMAs on the Alligator indicator remain above the signal line but are narrowing their range, while the AO histogram is forming corrective bars and declining within positive territory.
Resistance levels: 1.1750, 1.1880.
Support levels: 1.1650, 1.1510.
EUR/USD Trading Scenarios and Forecast
Long positions may be opened after a rally and consolidation above 1.1750, targeting the 1.1880 area. Stop-loss: 1.1660. Time horizon: 7 days or more.
Short positions may be opened after a decline and consolidation below 1.1650, targeting the 1.1510 area. Stop-loss: 1.1750.
Scenario
| Timeframe | Weekly |
| Recommendation | BUY STOP |
| Entry Point | 1.1755 |
| Take Profit | 1.1880 |
| Stop Loss | 1.1660 |
| Key Levels | 1.1510, 1.1650, 1.1750, 1.1880 |
Alternative Scenario
| Recommendation | SELL STOP |
| Entry Point | 1.1645 |
| Take Profit | 1.1510 |
| Stop Loss | 1.1750 |
| Key Levels | 1.1510, 1.1650, 1.1750, 1.1880 |
