

In particular, the decision was said to be driven by constructive dialogue with Iranian leadership aimed at de-escalating the armed conflict. At the same time, several news agencies, including Iran’s Tasnim and Fars, citing their own sources, reported that negotiations with the United States are effectively absent, and the suspension of strikes is linked to increasing pressure from financial markets and risks associated with US and Western debt instruments. Official Tehran has repeatedly emphasized its intention to continue its defensive strategy until the required level of deterrence is achieved, according to sources. On Monday, the US president issued an ultimatum demanding that the Strait of Hormuz be reopened within 48 hours, warning that Iranian energy infrastructure could be targeted if demands were not met. In response, Iranian authorities announced readiness for “mirror” measures targeting US and Israeli military bases in the region. The rhetoric immediately impacted markets: according to Reuters and The Wall Street Journal, Brent Crude Oil futures dropped by more than 10.0%, while stock indices rose, reflecting expectations of possible de-escalation.
Regarding inventory data from the American Petroleum Institute (API), the report will be released today at 22:30 (GMT+2). Analysts expect last week’s increase of 6.600 million barrels to continue. Meanwhile, the US Energy Information Administration (EIA) report, scheduled for Wednesday at 16:30 (GMT+2), may also show growth from the current 6.156 million barrels, which could trigger a moderate downward correction.
Investment demand declined slightly last week, with trading volumes moving away from yearly highs. The Chicago Mercantile Exchange (CME) recorded 1.27 million futures positions on March 20, significantly below the 2.27 million recorded on March 19. Options activity also weakened, with 200,000 contracts registered on Friday — an interim monthly low for the asset.
Support and resistance levels
On the four-hour chart, price is consolidating slightly above the end of the 91.50–95.70 price gap and is likely to continue upward movement during today’s session.
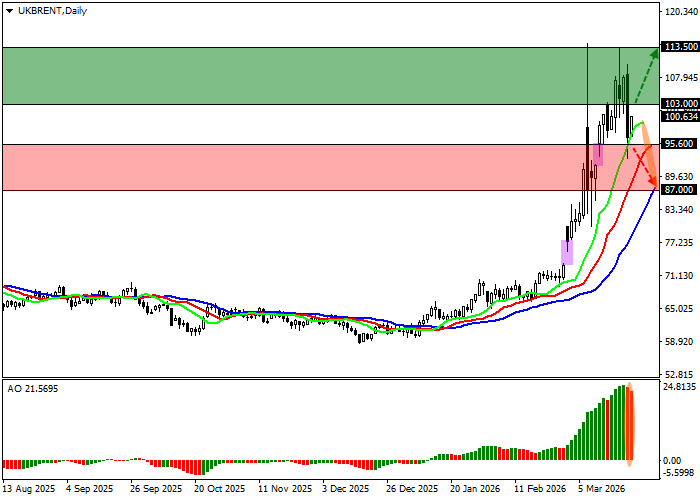
Technical indicators point to a continuation of the buy signal: fast EMAs of the Alligator indicator remain above the signal line and continue diverging, while the AO histogram forms new correction bars in positive territory.
Support levels: 95.60, 87.00.
Resistance levels: 103.00, 113.50.
Trading scenarios and Brent Crude Oil forecast
Long positions may be opened after price consolidates above 103.00 with a target at 113.50. Stop-loss — 100.00. Implementation period: 7 days or more.
Short positions may be opened after price consolidates below 95.70 with a target at 87.00. Stop-loss — 98.00.
Scenario
| Timeframe | Weekly |
| Recommendation | BUY STOP |
| Entry point | 103.05 |
| Take Profit | 113.50 |
| Stop Loss | 100.00 |
| Key levels | 87.00, 95.60, 103.00, 113.50 |
Alternative scenario
| Recommendation | SELL STOP |
| Entry point | 95.65 |
| Take Profit | 87.00 |
| Stop Loss | 98.00 |
| Key levels | 87.00, 95.60, 103.00, 113.50 |
