

For several days, rhetoric from US President Donald Trump about active negotiations with Iranian authorities created short-term price impulses. However, Tehran has consistently denied reports of bilateral dialogue since the escalation of the conflict on February 28.
This week, The New York Times reported that the White House, through intermediaries, sent Iranian officials a draft ceasefire agreement containing 15 points. Most of them repeat previous demands, including suspension of Iran’s nuclear program, restrictions on nuclear technology for civilian and defense purposes, decommissioning facilities in Natanz, Isfahan, and Fordow, and regulating Iran’s missile program at a later stage.
Additionally, Iran was reportedly asked to transfer uranium enriched to 60.0% to the International Atomic Energy Agency (IAEA), reopen the Strait of Hormuz, and confirm its status as a free maritime zone. In return, the US would fully lift sanctions, abandon the snapback mechanism, and support the development of civilian nuclear energy in Iran, including cooperation on projects such as the Bushehr nuclear power plant. Meanwhile, The Wall Street Journal reported that Iran prepared its own proposal, which differs significantly from the US plan. Tehran’s proposal reportedly includes full compensation for damage caused by US and Israeli actions, control over the Strait of Hormuz with the ability to charge transit fees, lifting all restrictions, and continuing its nuclear program without future limitations.
Investor activity declined this week, leading to a downward correction in trading volumes from yearly highs. The Chicago Mercantile Exchange (CME) reported 1.15 million futures positions on March 24, significantly below 2.27 million recorded on March 19. Options activity also weakened, with 186,000 contracts registered on Friday, marking an interim monthly low for the asset.
Regarding inventories, the American Petroleum Institute (API) reported another increase of 2.3 million barrels following a previous rise of 6.6 million barrels. Meanwhile, similar data from the US Energy Information Administration (EIA) showed inventories rising from 6.156 million barrels to 6.926 million barrels.
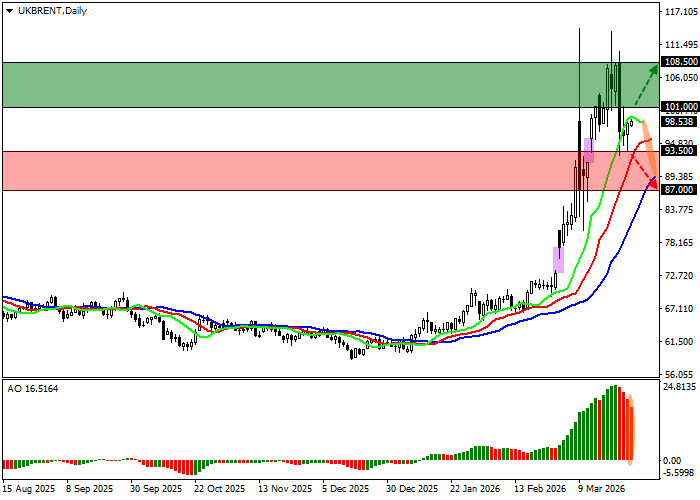
Support and resistance levels
On the four-hour timeframe, the price is trading slightly below the end of the price gap between 91.50 and 95.70 and may continue declining during today’s session.
Technical indicators point to weakening bullish momentum: fast EMAs of the Alligator indicator remain above the signal line but are converging toward it, while the AO histogram forms corrective bars in the buy zone.
Support levels: 93.50, 87.00.
Resistance levels: 101.00, 108.50.
Trading scenarios and Brent Crude Oil forecast
Long positions may be opened after consolidation above 101.00, with a target at 108.50. Stop-loss — 98.00. Timeframe: 7 days or more.
Short positions may be opened after consolidation below 93.50, with a target at 87.00. Stop-loss — 96.00.
Scenario
| Timeframe | Weekly |
| Recommendation | BUY STOP |
| Entry point | 101.05 |
| Take Profit | 108.50 |
| Stop Loss | 98.00 |
| Key levels | 87.00, 93.50, 101.00, 108.50 |
Alternative scenario
| Recommendation | SELL STOP |
| Entry point | 93.45 |
| Take Profit | 87.00 |
| Stop Loss | 96.00 |
| Key levels | 87.00, 93.50, 101.00, 108.50 |
