

The latest decline followed a shift in Washington’s strategy toward economic pressure on Iran. According to the US Department of the Treasury, the administration has launched Operation Economic Outcast and broadened the risk of secondary sanctions across digital assets, gold, technology, aviation and shipping. More than 60 entities, individuals and vessels linked to Iranian oil revenue, cyber operations and nuclear or missile procurement were also sanctioned.
Some traders initially interpreted the greater reliance on financial restrictions as reducing the immediate risk of another military escalation. That reading remains fragile, however, as Tehran has condemned the measures and Washington has confirmed that it is not currently holding direct talks with Iran.
US inventory data also weighed on prices. The American Petroleum Institute estimated that crude stocks increased by 4.2 million barrels in the week ended August 21, well above expectations of a 1.9 million-barrel build. Official Energy Information Administration data later showed a much smaller increase of approximately 0.1 million barrels, compared with the market forecast of 1.6 million barrels. The EIA report therefore confirmed a build, but it was considerably less bearish than the earlier API estimate.
The geopolitical backdrop continues to limit the downside. Preliminary Kpler data showed that only seven commodity vessels crossed the Strait of Hormuz on Thursday, down from 17 a day earlier and below the ten-day average of 15. Iran and Oman are still discussing the details of a proposed shipping corridor, while Tehran is preparing its own conditions for restoring normal traffic.
As discussed in our previous WTI Crude Oil forecast, prolonged restrictions in the strait remain one of the largest risks to global energy supplies. Iran has continued to threaten vessels using routes it considers unauthorized and has blacklisted 45 tankers for alleged violations of its transit rules. Until commercial traffic returns closer to normal levels, the possibility of renewed supply disruptions should continue to support oil prices.
Support and Resistance Levels
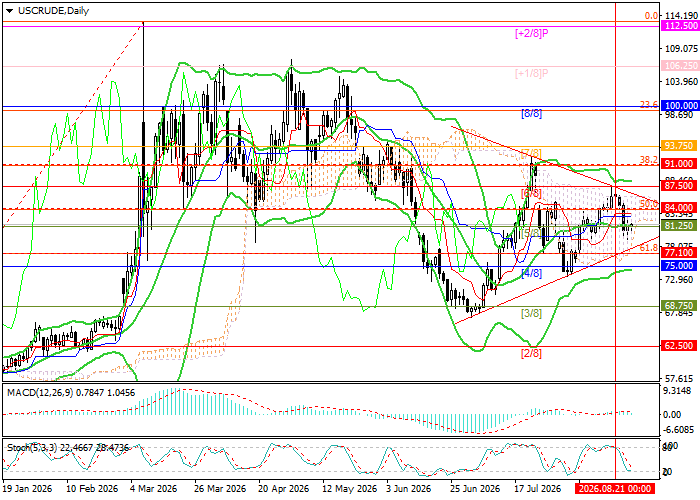
WTI has retreated toward the middle Bollinger Band at 81.25, corresponding to Murray [5/8]. A symmetrical triangle is forming on the chart, leaving the instrument vulnerable to a breakout in either direction.
A confirmed move below 77.10, the 61.8% Fibonacci retracement, could extend the decline toward 68.75 at Murray [3/8] and 62.50 at Murray [2/8]. Conversely, consolidation above 87.50 at Murray [6/8] would open the way toward 93.75 at Murray [7/8], followed by 100.00 at the 23.6% Fibonacci retracement and Murray [8/8], and then 106.25 at Murray [+1/8].
Technical indicators remain mixed. The Bollinger Bands are turning horizontal after their previous rise, the MACD histogram is holding close to the zero line, and the Stochastic Oscillator has entered oversold territory, creating the possibility of an upward reversal.
Support levels: 77.10, 68.75, 62.50.
Resistance levels: 87.50, 93.75, 100.00, 106.25.
WTI Crude Oil Trading Scenarios and Price Forecast
Long positions may be considered above 87.50, with targets at 93.75, 100.00 and 106.25 and a stop-loss at 83.00. Time frame: 5–7 days.
Short positions may be considered below 77.10, with targets at 68.75 and 62.50 and a stop-loss at 81.25.
Scenario
| Timeframe | Weekly |
| Recommendation | BUY STOP |
| Entry Point | 87.50 |
| Take Profit | 93.75, 100.00, 106.25 |
| Stop Loss | 83.00 |
| Key Levels | 62.50, 68.75, 77.10, 87.50, 93.75, 100.00, 106.25 |
Alternative Scenario
| Recommendation | SELL STOP |
| Entry Point | 77.10 |
| Take Profit | 68.75, 62.50 |
| Stop Loss | 81.25 |
| Key Levels | 62.50, 68.75, 77.10, 87.50, 93.75, 100.00, 106.25 |
Conclusion: WTI remains inside the 77.10–87.50 consolidation range. A breakout above 87.50 would return 93.75 and 100.00 to focus, while a move below 77.10 would strengthen the bearish scenario and expose the 68.75–62.50 support area.
