

The corporate earnings season for the second quarter and the first half of the year is continuing, with investors evaluating results from Nvidia Corp., the leading developer of graphics processing technologies. The company's revenue increased year-over-year from $46.70 billion to $96.20 billion, while earnings per share (EPS) rose from $1.04 to $2.22. Similar figures for HP Inc., the multinational manufacturer of personal computers and printers, increased from $13.93 billion to $15.70 billion in revenue and from $0.75 to $0.83 in EPS, respectively.
Meanwhile, the yield on the most popular 12-month medium-term bonds currently stands at 4.033%, up from 3.980% last Friday. The yield on benchmark 10-year bonds declined from 4.730% to 4.663%, 20-year bonds decreased from 5.259% to 5.173%, while global 30-year securities fell from 5.266% to 5.177%.
Among the top gainers were shares of Arista Networks Inc. (+5.92%), C.H. Robinson Worldwide Inc. (+5.62%), The Williams Companies Inc. (+4.68%), F5 Inc. (+4.40%) and The J.M. Smucker Co. (+4.34%).
The biggest declines were recorded by Moderna Inc. (−5.77%), GoDaddy Inc. (−4.26%), Eli Lilly and Co. (−3.59%), Boston Scientific Corp. (−3.39%) and Intuit Inc. (−3.24%).
Support and resistance levels
On the daily chart, the instrument is moving within a corrective trend, attempting to approach the upper boundary of a local ascending channel with the range of 7900.0–7400.0.
Technical indicators maintain a stable buy signal: the fast EMA lines of the Alligator indicator remain above the slow line, while the AO histogram is forming corrective bars in the positive zone.
Support levels: 7600.0, 7330.0.
Resistance levels: 7790.0, 8040.0.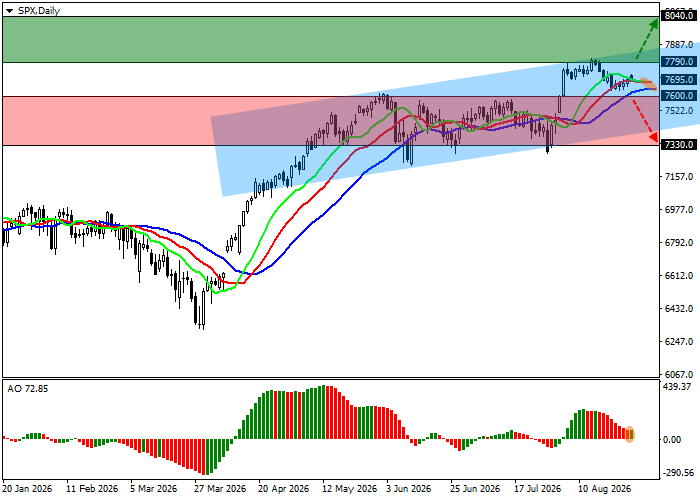
S&P 500 Trading Scenarios and Price Forecast
Long positions can be opened after the price rises and consolidates above the 7790.0 level, targeting 8040.0. The stop-loss level is set at 7700.0. Expected timeframe: 7 days or more.
Short positions can be opened after the price declines and consolidates below the 7600.0 level, targeting 7330.0. The stop-loss level is set at 7700.0.
Scenario
| Timeframe | Weekly |
| Recommendation | BUY STOP |
| Entry point | 7790.0 |
| Take Profit | 8040.0 |
| Stop Loss | 7700.0 |
| Key levels | 7330.0, 7600.0, 7790.0, 8040.0 |
Alternative Scenario
| Recommendation | SELL STOP |
| Entry point | 7600.0 |
| Take Profit | 7330.0 |
| Stop Loss | 7700.0 |
| Key levels | 7330.0, 7600.0, 7790.0, 8040.0 |
