

The chances of a settlement in the U.S.–Iran confrontation have declined significantly as neither side appears willing to make concessions and diplomatic contacts have effectively stalled. At the same time, traffic through the Strait of Hormuz, a critical route for global energy shipments, remains severely restricted amid conflicting statements from Tehran and Washington. According to vessel-tracking data from Kpler, no commercial ships passed through the waterway on Sunday, although limited transit resumed in the following days. The disruption continues to fuel concerns over global energy supplies and inflation, supporting demand for gold as a defensive asset.
Another source of support for the precious metal comes from continued central-bank buying. In July, the People’s Bank of China increased its gold reserves by around 640.0 thousand troy ounces, equivalent to almost 20.0 metric tons, bringing total holdings to approximately 76.08 million troy ounces. This was the largest monthly increase since October 2023 and reinforced the broader trend of central banks using gold to diversify reserves and hedge against geopolitical and inflation risks.
At the same time, high U.S. bond yields continue to limit the upside potential in XAU/USD. The benchmark 10-year Treasury yield is currently around 4.683%, not far from the late-July highs near 4.750%. Trading data from CME Group also indicate softer short-term activity in gold derivatives. On August 17, volume reached 141.7 thousand futures contracts and 47.2 thousand options contracts, remaining below average July levels. Futures activity changed only modestly over the week, while options volume fell more noticeably, pointing to weaker short-term positioning in this segment of the market.
Support and resistance levels
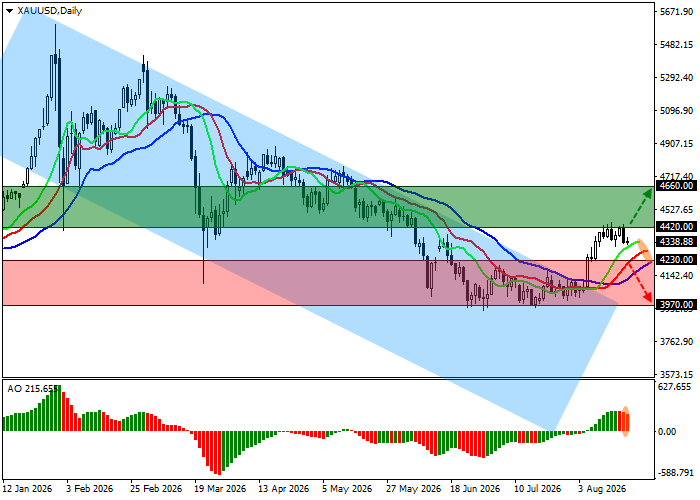
On the daily chart, the instrument remains in a corrective phase well above the resistance line of the descending channel, whose dynamic boundaries are currently located around 4100.0–3200.0.
Technical indicators continue to generate a strong buy signal: the fast EMAs of the Alligator indicator remain above the slow line, while the AO histogram is forming corrective bars in positive territory.
Resistance levels: 4420.0, 4660.0.
Support levels: 4230.0, 3970.0.
XAU/USD trading scenarios and price outlook
Long positions may be opened after the price rises and consolidates above 4420.0, with a target at 4660.0. Stop-loss: 4330.0. Time horizon: 7 days or more. Short positions may be opened after the price declines and consolidates below 4230.0, with a target at 3970.0. Stop-loss: 4310.0.
Scenario
| Timeframe | Weekly |
| Recommendation | BUY STOP |
| Entry point | 4420.0 |
| Take Profit | 4660.0 |
| Stop Loss | 4330.0 |
| Key levels | 3970.0, 4230.0, 4420.0, 4660.0 |
Alternative scenario
| Recommendation | SELL STOP |
| Entry point | 4230.0 |
| Take Profit | 3970.0 |
| Stop Loss | 4310.0 |
| Key levels | 3970.0, 4230.0, 4420.0, 4660.0 |
