

Strikes by the Shiite movement Ansar Allah, the blockade of the Strait of Hormuz, and reports of a potential closure of the Bab el-Mandeb Strait, along with a high probability of a U.S. ground operation in Iran, are increasing the likelihood of a prolonged crisis affecting key energy routes. At the same time, a modest optimistic signal remains in the market, namely hopes for negotiations between the United States and Iran that could help restore oil supplies. According to Pakistan’s Foreign Minister Ishaq Dar, a meeting between delegations of the two countries could take place in Islamabad in the coming days.
U.S. economic data released last week generally confirmed a slowdown in the economy while key sectors remain resilient. Initial jobless claims rose to 210K, while continuing claims fell to their lowest level since 2024, supporting the narrative of a “low hiring and firing” environment. The four-week average declined from 210.75K to 210.50K, while total claims fell from 1.851 million to 1.819 million, below the preliminary estimate of 1.860 million. Additional pressure on the instrument came from University of Michigan consumer sentiment data, which dropped to 53.3 points — the lowest level in several months — reflecting rising inflation expectations amid rapidly increasing fuel prices. This is an important signal, as deteriorating sentiment often precedes a decline in consumer spending — a key driver of the U.S. economy. This week, market participants will focus on the March labor market report. Tomorrow at 17:00 (GMT+2), February JOLTS data will be released, with job openings expected to decline from 6.946 million to 6.900 million. On Wednesday at 15:15 (GMT+2), traders will watch the ADP employment report, expected to slow from 63K to 42K, ahead of Friday’s official data from the U.S. Department of Labor.
Meanwhile, according to the latest report from the U.S. Commodity Futures Trading Commission (CFTC), net speculative positions in gold reached 168.3K last week compared to 159.9K previously. Investors continue to maintain significant long positions, with bullish positions backed by real money totaling 119.740K versus 26.965K for bearish positions. Last week, buyers reduced positions by 11.497K contracts, while sellers increased positions by 1.647K.
Support and Resistance Levels
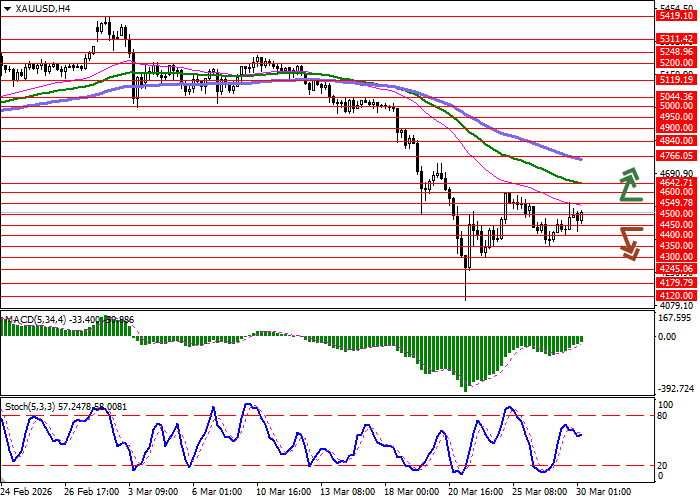
On the daily chart, Bollinger Bands show moderate contraction, while remaining wide enough for current market activity. MACD is turning upward, generating a new buy signal and approaching the signal line. Stochastic is rapidly approaching the 80 level, indicating risks of overbought conditions in the short term.
Resistance levels: 4549.78, 4600.00, 4642.71, 4766.05.
Support levels: 4500.00, 4450.00, 4400.00, 4350.00.
Trading Scenarios and XAU/USD Forecast
Long positions may be opened after a confident breakout above 4549.78 with a target at 4700.00. Stop-loss — 4480.00. Implementation period: 2–3 days.
A return of bearish momentum with a breakdown below 4450.00 may signal short positions targeting 4350.00. Stop-loss — 4500.00.
Scenario
| Timeframe | Intraday |
| Recommendation | BUY STOP |
| Entry Point | 4549.80 |
| Take Profit | 4700.00 |
| Stop Loss | 4480.00 |
| Key Levels | 4350.00, 4400.00, 4450.00, 4500.00, 4549.78, 4600.00, 4642.71, 4766.05 |
Alternative Scenario
| Recommendation | SELL STOP |
| Entry Point | 4449.95 |
| Take Profit | 4350.00 |
| Stop Loss | 4500.00 |
| Key Levels | 4350.00, 4400.00, 4450.00, 4500.00, 4549.78, 4600.00, 4642.71, 4766.05 |
Conclusion:
Gold continues to benefit from rising geopolitical risks and safe-haven demand, keeping the bullish momentum intact. However, upcoming U.S. labor data could trigger short-term volatility. A breakout above key resistance levels may open the door for further upside in the near term.
