- Details
-
 By Sagar Dua
 - 79
EUR/USD Forecast: Euro Retreats Amid US Inflation Surge and Fed Hawkish Signals
The European currency is posting a modest decline against the US dollar during the Asian session, extending its corrective impulse and testing the 1.1730 level for a downside breakout, as investors await the release of eurozone gross domestic product (GDP) data for the first quarter today at 11:00 (GMT+2): the figure is expected to rise 0.1% quarter-on-quarter and 0.8% year-on-year.
European Trade and Economic Security Commissioner Maros Sefcovic has previously warned that an effective blockade of the Strait of Hormuz could cause a significant slowdown in the regional economy (by at least –0.2% to as much as –6.0%), stressing that the scale of potential losses will depend on how long the Middle Eastern conflict persists. Should the negative trend continue in the coming months, EU public debt — which has already exceeded 82.0% of GDP and stands at €15.3 trillion — will continue to climb, while price pressures will intensify.
Market participants are also digesting April inflation data from Germany: the monthly reading eased from 1.1% to 0.6%, while the annual figure moved from 2.7% to 2.9%; the harmonised indicator shifted from 1.2% to 0.5% month-on-month and from 2.8% to 2.9% year-on-year, thereby confirming the impact of the energy crisis. Meanwhile, the ZEW Centre for European Economic Research Economic Sentiment Index improved from –17.2 points to –10.2 points against a preliminary estimate of –19.2 points; however, the Current Economic Conditions Index fell from –73.7 points to –77.8 points, a larger decline than analysts had anticipated. Commenting on the data, ZEW President Achim Wambach noted that investors still hope for an early resolution to the US–Iran standoff, yet weak industrial output, rising energy costs, and inflation running above the European Central Bank's (ECB) 2.0% target continue to exert unprecedented pressure on the German economy.
US market participants are also reviewing inflation statistics: the Consumer Price Index for April slipped from 0.9% to 0.6% month-on-month but rose from 3.3% to 3.8% year-on-year, beating the preliminary estimate of 3.7% and reaching its highest level since September 2023 — a move driven entirely by the sharp surge in energy prices amid the US–Iran confrontation. The core indicator, which excludes food and energy costs, gained 0.4% month-on-month and 2.8% year-on-year, significantly strengthening the hand of hawks within the Federal Reserve.
According to the Chicago Mercantile Exchange (CME) FedWatch Tool, the probability of the interest rate remaining in the 3.50–3.75% range at the June 17 meeting currently stands at a record 97.6%. In addition, the yield on 10-year US Treasury bonds has firmly established itself above 4.40%, placing direct downward pressure on the euro. Although the unemployment rate held at 4.3% and initial jobless claims remain near historically low levels, rising labour productivity and accelerating inflation suggest that monetary authorities will be compelled to maintain a restrictive policy stance for a prolonged period, thereby underpinning the US dollar.
At 14:30 (GMT+2), the US Producer Price Index (PPI) for April will be published, reflecting changes in wholesale goods prices across raw materials, semi-finished goods, and final products. Current forecasts suggest the annual reading will accelerate from 4.0% to 4.9%, with the core indicator rising from 3.8% to 4.3%.
Support and Resistance Levels
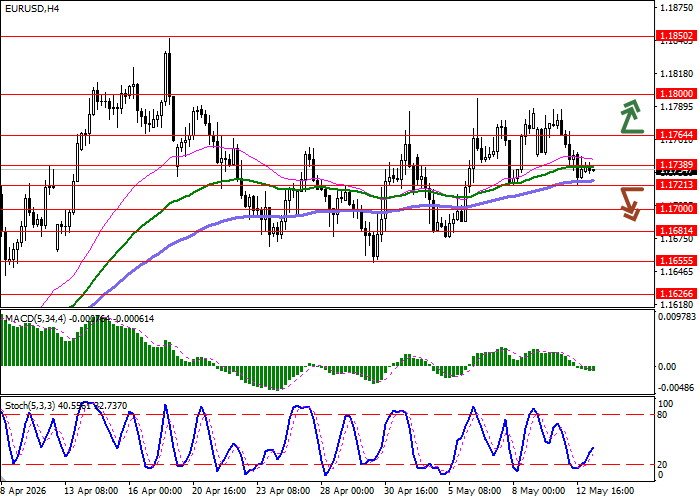
On the daily chart, the Bollinger Bands are displaying flat dynamics: the price range is narrowing slightly, constraining bulls from updating local highs. The MACD is turning downward, forming a new sell signal and attempting to consolidate below the signal line. The Stochastic is showing similar behaviour, turning lower from near the 80 level, which signals overbought risks for the single currency in the ultra-short-term outlook.
Resistance levels: 1.1738, 1.1764, 1.1800, 1.1850.
Support levels: 1.1721, 1.1700, 1.1681, 1.1655.
EUR/USD Trading Scenarios and Price Forecast
Short positions should be considered following a convincing downside breakout of 1.1721, targeting 1.1681. Stop-loss: 1.1738. Time horizon: 1–2 days.
A return of bullish momentum with a subsequent upside breakout of 1.1764 may serve as a signal to open new long positions targeting 1.1800. Stop-loss: 1.1745.
| Scenario | |
|---|---|
| Timeframe | Intraday |
| Recommendation | SELL STOP |
| Entry Point | 1.1720 |
| Take Profit | 1.1681 |
| Stop Loss | 1.1738 |
| Key Levels | 1.1655, 1.1681, 1.1700, 1.1721, 1.1738, 1.1764, 1.1800, 1.1850 |
| Alternative Scenario | |
|---|---|
| Recommendation | BUY STOP |
| Entry Point | 1.1765 |
| Take Profit | 1.1800 |
| Stop Loss | 1.1745 |
| Key Levels | 1.1655, 1.1681, 1.1700, 1.1721, 1.1738, 1.1764, 1.1800, 1.1850 |