

On Thursday, US President Donald Trump extended the deadline given to Iran to reopen the main maritime route, which previously accounted for up to 20.0% of global hydrocarbon traffic, until April 6, warning that otherwise attacks on Iran’s energy infrastructure would follow. The US military presence in the Persian Gulf is being strengthened, while the White House is considering launching a ground operation to gain control over the strategically important Khark Island. In a post on Truth Social, Trump stated that negotiations with Iran were progressing successfully, despite claims by some media outlets. However, Tehran representatives told Reuters that Washington’s proposal, delivered through Pakistan, does not consider Iran’s interests. The situation has already removed around 11.0 million barrels per day of oil supply from the market, and analysts at the International Energy Agency (IEA) described the current crisis as more severe than the combined energy shocks of the 1970s and the gas shortage triggered by Russia’s aggression against Ukraine. According to The Wall Street Journal, Iran has neither demanded a ceasefire nor responded to diplomatic proposals. Analysts at Macquarie Group Ltd. expect prices to decline once tensions ease, though remaining above levels seen at the start of the year. However, if escalation continues, prices could reach 200.00, while in the near term the March high near 101.95 may be retested. Meanwhile, fuel inventory data from the American Petroleum Institute (API) showed an increase of 2.3 million barrels versus expectations of –1.3 million and 6.6 million previously, which is considered a normal correction and had limited impact on prices.
According to Reuters, approximately 40.0% of Russia’s export capacity, supplying about 2.0 million barrels per day, has been temporarily disrupted due to Ukrainian strikes and detentions of tankers from the so-called “shadow fleet,” marking the largest logistical disruption in modern Russian history. Drone attacks on ports in Primorsk and Ust-Luga in the Baltic Sea were reported in March, halting oil shipments, while similar issues have been observed in Novorossiysk on the Black Sea, further supporting global oil prices.
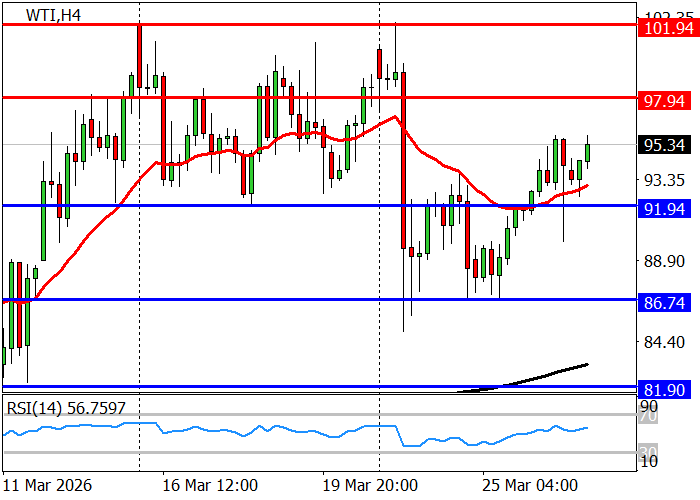
Support and resistance levels
The long-term trend remains upward: after correcting to the support area of 86.74 at the beginning of the week, prices resumed growth with targets at 97.95, 101.95, and 114.00. On the daily chart, the price remains above EMA (21) and EMA (190), indicating strong buyer momentum, while RSI (14) entered overbought territory in early March but has now returned to neutral levels.
The medium-term trend briefly shifted downward earlier this week but then reversed into a correction, reaching the trend boundary at 96.64–95.57 before declining to 90.78. Today, the price is rising again, testing the 96.64–95.57 area. Short positions may become relevant from this zone with targets at 90.78 and 84.93, but if the level is broken, the trend will shift upward, and further growth toward zone 2 (107.28–106.21) becomes likely.
Resistance levels: 97.95, 101.95, 114.00.
Support levels: 91.94, 86.74, 81.90.
Trading scenarios and WTI Crude Oil forecast
Long positions may be opened from 91.94 with a target at 97.94 and stop-loss at 89.40. Implementation period: 9–12 days.
Short positions may be opened below 89.40 with a target at 84.95 and stop-loss at 91.42.
Scenario
| Timeframe | Weekly |
| Recommendation | BUY LIMIT |
| Entry point | 91.94 |
| Take Profit | 97.94 |
| Stop Loss | 89.40 |
| Key levels | 81.90, 86.74, 91.94, 97.95, 101.95, 114.00 |
Alternative scenario
| Recommendation | SELL STOP |
| Entry point | 89.35 |
| Take Profit | 84.95 |
| Stop Loss | 91.42 |
| Key levels | 81.90, 86.74, 91.94, 97.95, 101.95, 114.00 |
