

At its meeting on November 3, the Reserve Bank of Australia (RBA) increased its cash rate target by 25 basis points to 4.85%, bringing the cumulative increase this year to 125 basis points across five hikes. In its monetary policy statement, the central bank highlighted persistent, broadly based inflation, higher energy costs associated with the Middle East conflict, and domestic capacity pressures. Policymakers judged that further tightening was necessary despite slowing economic activity, falling housing prices, and rising unemployment. Future decisions will depend on incoming data and changes in the inflation outlook.
Meanwhile, the Bank of Japan maintained its short-term policy rate at around 1.25% on October 30, with one board member proposing an increase to 1.50%. Its accompanying outlook retained a tightening bias, with further adjustments dependent on economic activity, prices, and financial conditions. Expectations of additional policy normalisation could support the yen, although neither the timing nor the size of the next increase has been confirmed. The Japanese monetary policy backdrop was also examined in our previous USD/JPY forecast.
For AUD/JPY, the relevant policy rate differential is between Australia and Japan: the current gap stands at approximately 3.60 percentage points in Australia's favour. This supports the Australian dollar's appeal in carry trades, where investors borrow in a lower-yielding currency to hold higher-yielding assets. A stronger yen would therefore require additional support, potentially from a narrowing in expected rate differentials or a reduction in investors' willingness to hold such positions. These are conditional drivers rather than confirmation of an inevitable decline.
Overall, the downside outlook remains a technical scenario that requires confirmation below 108.00. Further Japanese policy tightening or weaker risk appetite could reinforce it, while persistent Australian inflation and additional RBA rate increases could limit losses.
On the weekly chart, the technical setup identifies a potential head-and-shoulders reversal pattern with its neckline near 108.00. A sustained break below the neckline would provide stronger confirmation of the bearish formation.
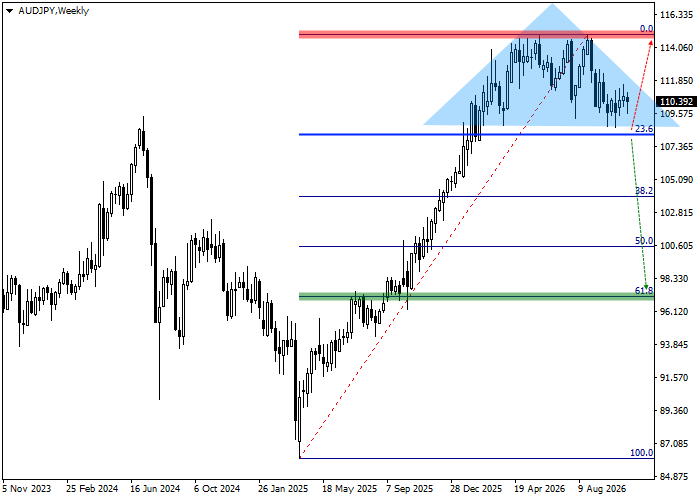
The failure to break above the previous high at 115.00 keeps this reversal scenario in focus. The neckline at 108.00 also lies near the 23.6% Fibonacci retracement level identified in the analysis, making this area an important support zone.
The daily timeframe provides a closer view of the key levels.
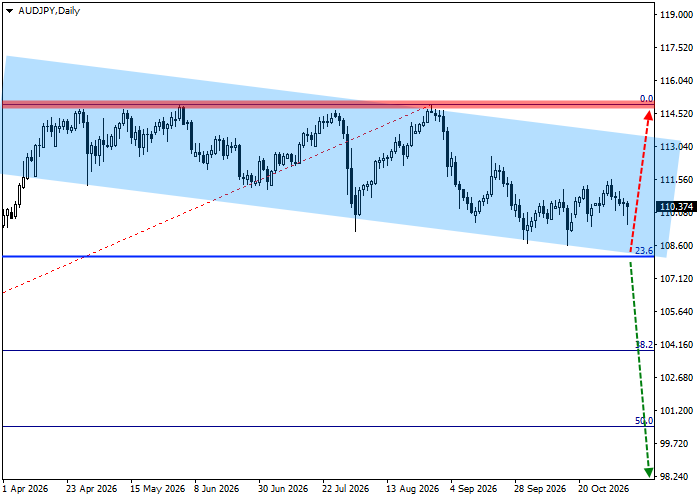
A sustained break below the support line of the local channel, whose boundaries are at 113.50–108.00, could open the way for a deeper decline. The downside target is 97.00, corresponding to the 61.8% Fibonacci retracement level used in this setup, where profit-taking on short positions may be considered. Conversely, a recovery toward 115.00, the 0.0% Fibonacci reference level, would materially weaken the bearish outlook. A sustained move above this resistance would invalidate the proposed reversal scenario.
The four-hour timeframe can be used to assess confirmation of a potential entry.
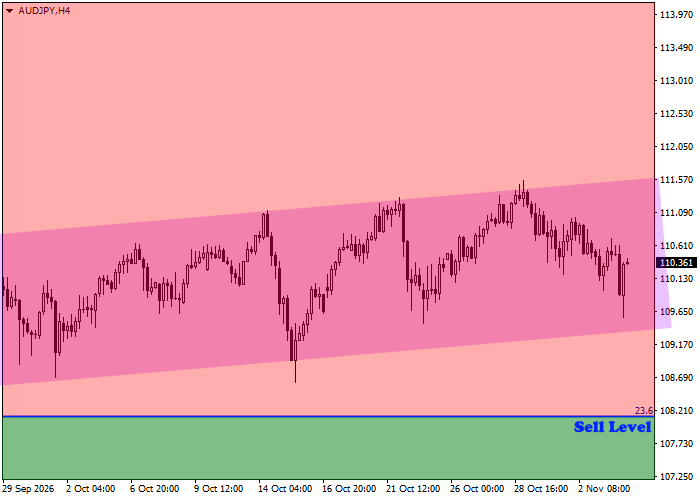
The proposed trigger for short positions is a break below 108.00, identified as the October 15 low, followed by consolidation beneath this level. This would confirm a loss of support and strengthen the case for a move toward 97.00. The scenario is intended for the quarterly horizon, but the time required to reach the target will depend on the persistence of the trend, changes in monetary policy expectations, and market volatility. Average daily price fluctuations alone do not provide a reliable estimate of when a directional target will be reached.
