

Earlier, Reserve Bank of Australia (RBA) Deputy Governor Christopher Kent delivered a semiannual report on methods for assessing current macroeconomic indicators and addressed monetary policy and fundamental factors. According to officials, economic conditions have been changing significantly since September last year, preventing inflation from stabilizing at the 2.0% target level. Moreover, amid the escalation of the Middle East crisis, average diesel fuel prices have already exceeded 3.0 dollars per liter in almost all major cities. Treasurer Jim Chalmers stated that he had asked Treasury officials to model the consequences of “more complex circumstances” if global oil prices rise above 120.0 dollars per barrel for a prolonged period. According to the report, economic growth in Australia since the start of the US-Iran confrontation has been weaker than in comparable economies, which could lead to further tightening of monetary conditions. Analysts still expect the regulator to maintain a hawkish stance this year but refrain from policy changes at the May meeting, preferring to assess the impact of two consecutive tightening steps. Markets currently price in a 65.0% probability of rate hikes in June and again in September.
As for the US dollar, which continues to dominate the AUD/USD pair, it is currently trading near 99.5 in the USDX index and remains heavily dependent on developments in the Middle East, where signals of potential peace negotiations have re-emerged. Despite the ultimatum-style 15-point agreement proposed by the White House, Iranian officials stated they would review the conditions. The document includes suspension of the nuclear program, restrictions on related technologies for civilian and defense purposes, decommissioning of facilities in Natanz, Isfahan, and Fordow, and regulation of the missile program at a later stage. Nevertheless, according to The Wall Street Journal sources in the House of Representatives and Senate, a ground operation is still planned and could begin soon, with Khark Island — through which Iran exports around 90.0% of its oil — considered a likely target.
Meanwhile, US import prices in February rose at the fastest pace in four years, increasing by 1.3%, driven by higher electricity and oil costs (up to +35.0% at peak levels). Additionally, initial jobless claims rose to 210.0 thousand compared to 205.0 thousand previously, while continuing claims reached 1.819 million, slightly below the previous 1.851 million.
Support and Resistance Levels
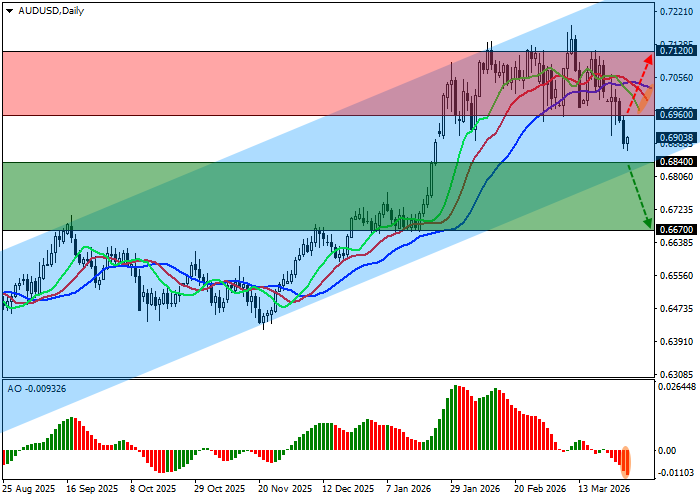
On the daily chart, the instrument remains slightly below the support line of the ascending channel with dynamic boundaries of 0.7200–0.6900.
Technical indicators strengthened the sell signal in early March: fast EMAs on the Alligator indicator are directed downward and remain at a noticeable distance from the signal line, while the AO histogram has formed several new bearish bars in the sell zone.
Support levels: 0.6840, 0.6670.
Resistance levels: 0.6960, 0.7120.
Trading Scenarios and AUD/USD Outlook
Short positions may be opened after consolidation below 0.6840 with a target at 0.6670. Stop-loss — 0.6920. Implementation period: 7 days or more.
Long positions may be opened after consolidation above 0.6960 with a target at 0.7120. Stop-loss — 0.6880.
Scenario
| Timeframe | Weekly |
| Recommendation | SELL STOP |
| Entry Point | 0.6835 |
| Take Profit | 0.6670 |
| Stop Loss | 0.6920 |
| Key Levels | 0.6670, 0.6840, 0.6960, 0.7120 |
Alternative Scenario
| Recommendation | BUY STOP |
| Entry Point | 0.6965 |
| Take Profit | 0.7120 |
| Stop Loss | 0.6880 |
| Key Levels | 0.6670, 0.6840, 0.6960, 0.7120 |
