

According to the minutes of the regulator's September meeting published yesterday, all 19 Federal Reserve officials participating in the policy discussions supported an interest rate increase, while the formal FOMC decision was approved unanimously by all 12 voting members. Most policymakers believe another increase in borrowing costs may be necessary before the end of the year. Monetary tightening is more likely to take place in December, after the start of the third-quarter corporate earnings season. According to the CME FedWatch Tool, the probability of another rate increase by December is currently around 85.0%, while the probability of keeping rates unchanged in October stands near 78.4%.
An active upward trend remains evident in the US government bond market, with yields across most maturities approaching multi-year highs. The yield on short-term 12-month Treasury securities increased from 4.412% last week to 4.456%, while the benchmark 10-year yield climbed from 5.270% to around 5.308%, reaching its highest levels in more than two decades. The yield on long-term 20-year bonds rose from 5.693% to 5.740%, while the 30-year yield increased from 5.642% last Friday to approximately 5.698%.
Among the leading Nasdaq 100 gainers in the previous session were Micron Technology Inc. (+4.06%), Amgen Inc. (+2.60%), Intuit Inc. (+2.56%), Intuitive Surgical Inc. (+2.41%) and Sandisk Corp. (+1.92%).
The biggest declines were recorded by Strategy Inc. (formerly MicroStrategy, –6.79%), Nebius Group N.V. (–5.09%), CrowdStrike Holdings Inc. (–4.81%), Teradyne Inc. (–4.31%) and Rocket Lab Corp. (–4.18%).
As discussed in our previous Nasdaq 100 forecast, rising Treasury yields and uncertainty surrounding Federal Reserve monetary policy remain important factors influencing technology stocks.
Support and resistance levels
On the daily chart, the trading instrument is retreating from the resistance line of the local descending channel with dynamic boundaries of 29500.0–26600.0.
Technical indicators maintain a stable buy signal: the fast EMAs of the Alligator indicator remain above the slow ones, while the AO histogram is forming corrective bars and moving away from the zero line.
Support levels: 30700.0, 28900.0.
Resistance levels: 31500.0, 33000.0.
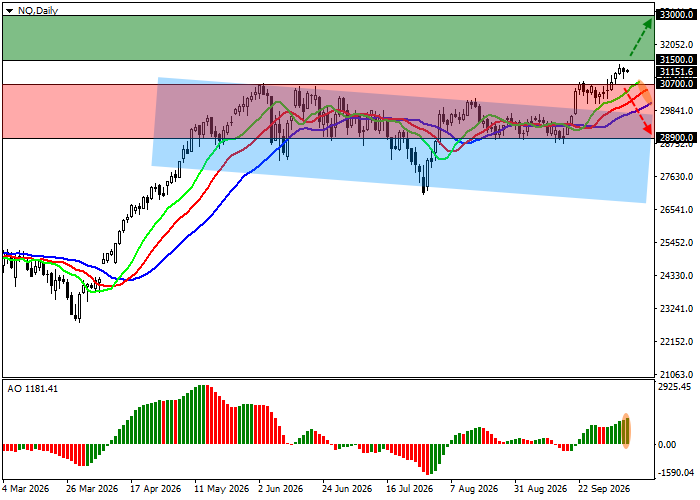
Nasdaq 100 trading scenarios and price forecast
Long positions may be opened after the price rises and consolidates above 31500.0, with a target at 33000.0. Stop-loss — 31000.0. Estimated implementation period: 7 days or more.
Short positions may be opened after the price declines and consolidates below 30700.0, with a target at 28900.0. Stop-loss — 31300.0.
Scenario
| Timeframe | Weekly |
| Recommendation | BUY STOP |
| Entry point | 31500.0 |
| Take Profit | 33000.0 |
| Stop Loss | 31000.0 |
| Key levels | 28900.0, 30700.0, 31500.0, 33000.0 |
Alternative scenario
| Recommendation | SELL STOP |
| Entry point | 30700.0 |
| Take Profit | 28900.0 |
| Stop Loss | 31300.0 |
| Key levels | 28900.0, 30700.0, 31500.0, 33000.0 |
