

The Canadian currency remains under pressure from the escalating trade conflict with the United States. New US tariffs of up to 50% on approximately $20.0 billion worth of Canadian goods took effect on August 22 after bilateral trade negotiations failed to produce an agreement. Canada responded with retaliatory tariffs on approximately $20.0 billion worth of US imports, which came into effect on September 8.
The trade dispute continues to weigh on the Canadian economy. In September, the S&P Global Services PMI increased from 46.8 points to 48.3 points but remained below the 50.0 threshold for a fourth consecutive month, signalling another contraction in business activity. Companies continued to report pressure from trade uncertainty, elevated energy costs related to the Middle East conflict and higher operating expenses.
Additional uncertainty for the Canadian dollar comes from the provincial election in Quebec, where the separatist Parti Québécois led by Paul St-Pierre Plamondon won 59 of 127 seats. Although the party fell short of an outright majority, its victory has revived discussion of Quebec independence. Plamondon has pledged to hold another referendum after US President Donald Trump leaves office, increasing longer-term political uncertainty in Canada.
At the same time, the latest Canadian trade data provided some support to the national currency. Canada's trade surplus widened sharply to C$4.2 billion in August, significantly exceeding market expectations of around C$1.55 billion and reaching its highest level in more than four years. Exports increased by 2.5% to C$77.91 billion, driven in part by an 8.1% surge in shipments to the United States ahead of the latest US tariffs, while imports declined by 2.0% to C$73.71 billion.
The stronger-than-expected trade figures may slow the advance in USD/CAD, although continuing tariff uncertainty and the broader strength of the US dollar could limit the Canadian currency's recovery.
The US currency is also supported by strong September business activity data. The S&P Global Services PMI increased from 56.5 points in August to 58.8 points in September, slightly above the preliminary estimate of 58.7 points and marking the strongest expansion since July 2021.
Overall, the US economy continues to demonstrate resilience despite signs of cooling in the labour market. Expectations of an October Federal Reserve rate increase have declined substantially, with markets currently assigning only around a 22% probability to another hike this month. However, another increase at the December meeting remains widely expected, with market pricing indicating a probability of roughly 84–87%, supporting the US dollar over the medium term.
As discussed in our previous USD/CAD forecast, the divergence between US and Canadian financial conditions, combined with trade uncertainty, continues to support the pair near multi-month highs.
Support and resistance levels
The trading instrument has broken above the upper boundary of the long-term sideways range of 1.4160–1.3549 and is forming a new ascending channel. The price is testing 1.4290 (61.8% Fibonacci retracement, Murray level [5/8]). A breakout above this level may allow the pair to reach 1.4404 (Murray level [6/8]) and 1.4526 (Murray level [7/8], upper boundary of the channel).
However, if the price consolidates below 1.4160 (Murray level [4/8], 50.0% Fibonacci retracement), a decline toward 1.3916 (Murray level [2/8]) and 1.3793 (Murray level [1/8], 23.6% Fibonacci retracement) may follow.
Technical indicators maintain a buy signal: the Bollinger Bands are turning upward, the MACD histogram is increasing in positive territory, while the Stochastic oscillator has reached the overbought zone, which does not rule out a limited correction.
Resistance levels: 1.4290, 1.4404, 1.4526.
Support levels: 1.4160, 1.3916, 1.3793.
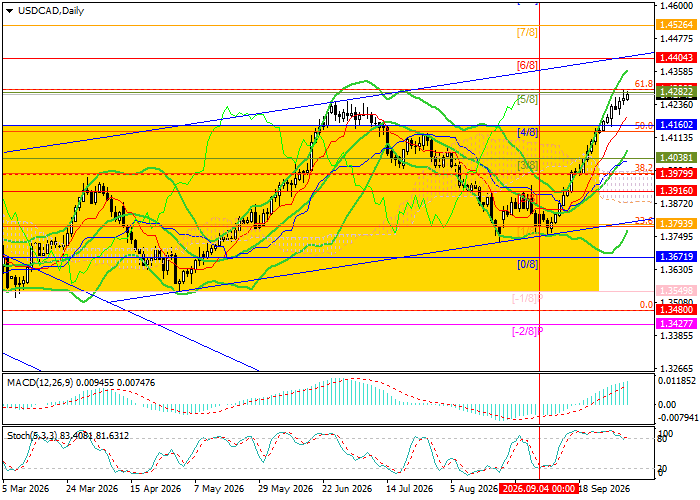
USD/CAD trading scenarios and exchange rate forecast
Long positions may be opened above 1.4290 with targets at 1.4404 and 1.4526 and a stop-loss at 1.4220. Estimated implementation period: 5–7 days.
Short positions may be opened below 1.4160 with targets at 1.3916 and 1.3793 and a stop-loss at 1.4270.
Scenario
| Timeframe | Weekly |
| Recommendation | BUY STOP |
| Entry point | 1.4290 |
| Take Profit | 1.4404, 1.4526 |
| Stop Loss | 1.4220 |
| Key levels | 1.3793, 1.3916, 1.4160, 1.4290, 1.4404, 1.4526 |
Alternative scenario
| Recommendation | SELL STOP |
| Entry point | 1.4160 |
| Take Profit | 1.3916, 1.3793 |
| Stop Loss | 1.4270 |
| Key levels | 1.3793, 1.3916, 1.4160, 1.4290, 1.4404, 1.4526 |
