
Negative dynamics are developing amid renewed fighting in Yemen and escalating tensions involving Saudi Arabia. Houthi forces have regained significant territory along Yemen's Red Sea coast after Saudi-backed government troops had recently pushed them away from the Bab el-Mandeb Strait and the strategic port of Mocha. Recent reports indicate that the Houthis have once again expanded their control across almost the entire Yemeni Red Sea coastline, increasing risks to one of the world's most important maritime trade routes.
The precious metal is also under pressure from the US government bond market, where the yield on benchmark 10-year Treasury securities has risen above 5.30%, reaching its highest level in more than two decades. Higher yields increase the opportunity cost of holding non-yielding precious metals such as silver and gold.
The rise in yields has been reinforced by the Federal Reserve's still relatively hawkish policy outlook. Minutes from the September meeting showed that voting members unanimously supported a 25-basis-point increase in the federal funds target range to 3.75–4.00%, the first rate increase in more than three years.
At the same time, policymakers were divided over the reasons for the move. Some officials viewed the increase mainly as insurance against energy and supply-related inflation, while others were more concerned about broader demand-driven price pressures. Most participants nevertheless considered another rate increase before the end of the year likely to be appropriate.
Another factor limiting silver's recovery is the continued divergence between gold and silver prices. With gold trading around 4115.00–4130.00 and silver near 59.00–60.00, the gold-to-silver ratio is currently close to 70:1, remaining above the levels seen during periods of stronger silver performance.
This suggests that gold continues to outperform silver as investors favour the more traditional defensive asset amid elevated geopolitical and fiscal uncertainty. Silver's greater exposure to industrial demand also makes it more sensitive to concerns about slowing global economic activity.
As discussed in our previous XAG/USD forecast, elevated Treasury yields and geopolitical uncertainty have remained the main factors behind silver's correction from the late-August highs.
Support and resistance levels
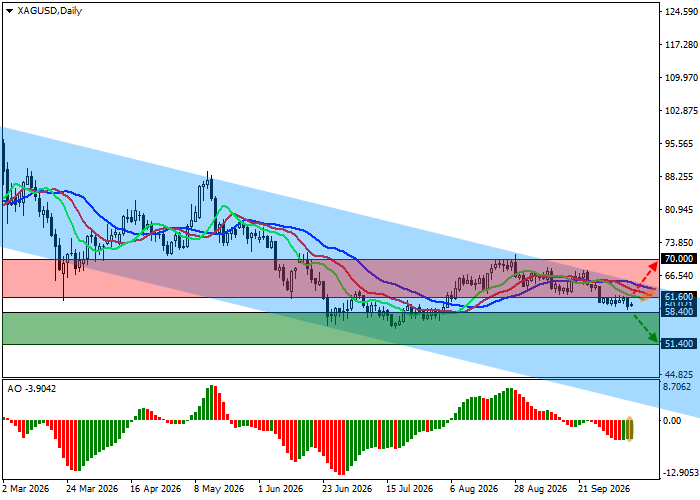
On the daily chart, the trading instrument remains below the resistance line of the global descending channel with dynamic boundaries of 65.00–40.00.
Technical indicators maintain an unstable sell signal: the fluctuation range of the Alligator indicator's EMAs remains broadly unchanged and directed downward, while the AO histogram is forming corrective bars below the transition level.
Support levels: 58.40, 51.40.
Resistance levels: 61.60, 70.00.
XAG/USD trading scenarios and price forecast
Short positions may be opened after the price declines and consolidates below 58.40, with a target at 51.40. Stop-loss — 62.00. Estimated implementation period: 7 days or more.
Long positions may be opened after the price rises and consolidates above 61.60, with a target at 70.00. Stop-loss — 57.00.
Scenario
| Timeframe | Weekly |
| Recommendation | SELL STOP |
| Entry point | 58.40 |
| Take Profit | 51.40 |
| Stop Loss | 62.00 |
| Key levels | 51.40, 58.40, 61.60, 70.00 |
Alternative scenario
| Recommendation | BUY STOP |
| Entry point | 61.60 |
| Take Profit | 70.00 |
| Stop Loss | 57.00 |
| Key levels | 51.40, 58.40, 61.60, 70.00 |
